Seasonal Strategy on US Equities + Genovest tests Quantpedia’ strategy

A new financial research paper has been published and is related to:

#31 – Market Seasonality Effect in World Equity Indexes
#41 – Turn of the Month in Equity Indexes
#75 – Federal Open Market Committee Meeting Effect in Stocks

Authors: Hull, Bakosova, Kment

Title: Seasonal Effects and Other Anomalies

Link: https://papers.ssrn.com/sol3/papers.cfm?abstract_id=3165669

Abstract:

We revisit a series of popular anomalies: seasonal, announcement and momentum. We comment on statistical significance and persistence of these effects and propose useful investment strategies to incorporate this information. We investigate the creation of a seasonal anomaly and trend model composed of the Sell in May (SIM), Turn of the Month (TOM), Federal Open Market Committee pre-announcement drift (FOMC) and State Dependent Momentum (SDM). Using the total return S&P 500 dataset starting in 1975, we estimate the parameters of each model on a yearly basis based on an expanding window, and then proceed to form, in a walk forward manner, an optimized combination of the four models using a return to risk optimization procedure. We find that an optimized strategy of the aforementioned four market anomalies produced 9.56% annualized returns with 6.28% volatility and a Sharpe ratio of 0.77. This strategy exceeds that Sharpe ratio of Buy-and-Hold in the same period by almost 100%. Furthermore, the strategy also adds value to the previously published market-timing models of Hull and Qiao (2017) and Hull, Qiao, and Bakosova (2017). A simple strategy which combines all three models more than doubles the Sharpe ratio of Buy-and-Hold between 2003-2017. The combined strategy produces a Sharpe ratio of 1.26, with annualized returns of 18.03% and 13.26% volatility. We publish conclusions from our seasonal trend and anomaly model in our Daily Report.

Notable quotations from the academic research paper:

"In this paper we combine seasonal anomalies, Fed announcement and trend in a walk forward way. Numerous papers present compelling evidence on seasonal effects of the market, with Turn of the Month and the Halloween effect being the most convincing. At the same time there appears to be an excess return prior to Fed meetings. We combine these effects with the new trend indicator to create an effectiv emodel that beats Buy-and-Hold. This Seasonal Anomaly and Trend Model is then combined in an ensemble with other market timing models into an even more powerful strategy.

We start with four robust seasonal anomalies, and propose a simple deterministic trading strategy for each. Then we introduce a few different options of combining these four strategies. First, we look at the mean-variance optimization algorithm (Markowitz 1952), and second, we perform a grid search on model weights to look for optimal combination of signals rather than using portfolio optimization. Last, we also consider a simple equal weight portfolio for comparison. The results are as follows. From 1976 to 2017, the equally weighted model produces the highest Sharpe ratio (0.89 compared to 0.77 of the grid search algorithm and 0.80 for the mean-variance algorithm). However, the grid search model produces the highest Sharpe ratio of 0.84 in more recent period (1996-2017), compared to 0.82 and 0.78 for equal weight and mean-variance algorithm respectively. The univariate strategies are restricted to be between 0% and 150% invested in S&P 500, with the exception of the trend model which is capped between -50% and 150%. We maximize the backtested Sharpe ratio in our analysis, since this metric is rather invariant to scaling. Investors wishing to deploy these models in their portfolios can subsequently choose their level of leverage based on their risk preferences.

The seasonal trend model also enhances the market-timing models of Hull and Qiao (2017) and Hull, Qiao, and Bakosova (2017). A simple strategy which combines all three models almost triples the Sharpe ratio of Buy-and-Hold between 2003-2017. The combined strategy produces a Sharpe ratio of 1.26, with annualized returns of 18.03% and 13.26% volatility.

Figure 13 shows the wealth accumulation of the combined strategy relative to Buy-and-Hold. The outperformance is not economically significant in the bull market of the early 2000s but becomes more pronounced in the volatile period during the Global Financial Crisis (GFC) and in the jittery markets of 2011-2012.
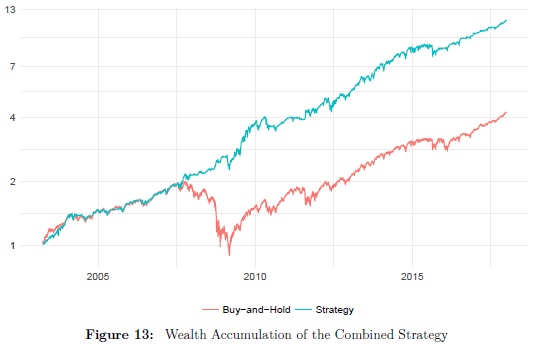
Wealth accumulation of combined seasonal trading strategy

"


Quantpedia & Genovest cooperation

We started a very interesting cooperation with a guys from Genovest. They started to analyze some of Quantpedia's suggested strategies. The first article analyzes a well-known Graham's Net Current Asset Value strategy and shows that the strategy has not lost its outperformance during the last few years:

https://genovest.com/blog/putting-quantpedia-to-the-test/
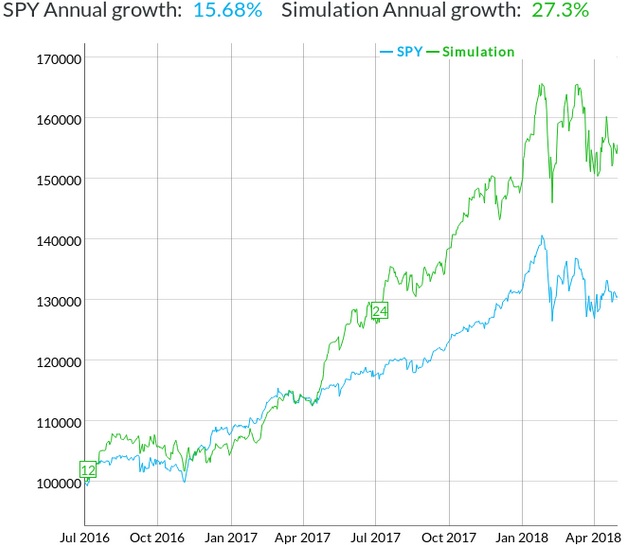
Net Current Asset Value strategy

The strategy's rules are really simple. Investor only buy stocks with NCAV (net current asset value, as defined by Graham, is current assets minus all liabilities, divided by the number of shares outstanding) over 1.5, exclude lightly-regulated companies, and exclude companies in the financial sector. The portfolio of stocks is formed annually in July, and held for one year with equal weighting.

We are looking forward to any new strategy's backtest …


Are you looking for more strategies to read about? Check http://quantpedia.com/Screener

Do you want to see performance of trading systems we described? Check http://quantpedia.com/Chart/Performance

Do you want to know more about us? Check http://quantpedia.com/Home/About


Follow us on:

Facebook: https://www.facebook.com/quantpedia/

Twitter: https://twitter.com/quantpedia
Continue reading »

Quantpedia Update – 2nd May 2018

Two new strategies have been added:

#388 – Implied Skewness Strategy in Commodities
#389 – Cryptomarket Discounts

One new related research paper has been included into existing strategy reviews. And two additional related research papers have been included into existing free strategy reviews during last 2 weeks.

Continue reading »

Bitcoin Is Not the New Gold

Is Bitcoin a new gold – aka. a hedge or safe heaven asset during equity downturns? Short answer – No. Again, recommended read about cryptocurrencies … :

Authors: Klein, Hien, Walther

Title: Bitcoin Is Not the New Gold: A Comparison of Volatility, Correlation, and Portfolio Performance

Link: https://papers.ssrn.com/sol3/papers.cfm?abstract_id=3146845

Abstract:

Cryptocurrencies such as Bitcoin are establishing themselves as an investment asset and are often named the New Gold. This study, however, shows that the two assets could barely be more different. Firstly, we analyze and compare conditional variance properties of Bitcoin and Gold as well as other assets and nd differences in their structure. Secondly, we implement a BEKK-GARCH model to estimate time-varying conditional correlations. Gold plays an important role in financial markets with flight-to-quality in times of market distress. Our results show that Bitcoin behaves as the exact opposite and it positively correlates with downward markets. Lastly, we analyze the properties of Bitcoin as portfolio component and nd no evidence for hedging capabilities. We conclude that Bitcoin and Gold feature fundamentally different properties as assets and linkages to equity markets. Our results hold for the broad cryptocurrency index CRIX. As of now, Bitcoin does not reflect any distinctive properties of Gold other than asymmetric response in variance.

Notable quotations from the academic research paper:

"Cryptocurrencies, in particular Bitcoin, have been labeled the New Gold by some media,banks, and also data providers throughout the last years. While this view might be motivated by fast and high returns in a gold rush like environment, we compare Gold and Bitcoin from an econometric perspective and focus on the economic aspects of cryptocurrencies as an investment asset. We address the question how cryptocurrencies can be classi fied based on volatility behavior and how they are correlated with already established asset classes.

The analysis in this paper is subdivided into three parts. Firstly, we start by investigating the volatility behavior of cryptocurrencies in comparison to stock indices and commodities.

Secondly, this research explores the hedge and safe haven capabilities of cryptocurrencies in comparison to Gold by means of a dynamic correlation analysis. We apply the definition of hedge, diversifi er, and safe haven given in Baur & Lucey (2010). An asset which is uncorrelated or negatively correlated with another asset is de fined as a hedge whereas a safe haven asset is uncorrelated or negatively correlated with other assets in distressed markets only. Assets which are a diversi fier are positively (on average), but not perfectly correlated to other assets.

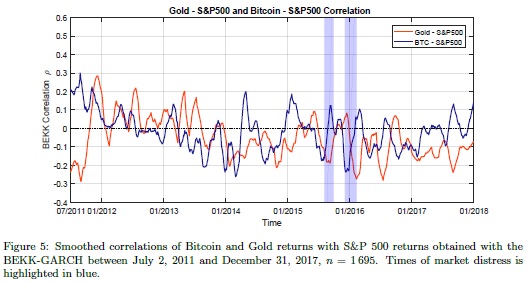
What makes the Bitcoin – S&P 500 correlation fundamentally di fferent from the correlationsof Gold and the index is the behavior during market distress. Interestingly, correlations are steeply increasing from negative to a positive relationship while the index is in a downward movement. This indicates that Bitcoin follows the downturn, which is observable in the raw as well as smoothed correlations in Fig. 4. The same behavior holds for the Bitcoin – MSCI World correlations. While Gold prices increase in the flight-to-quality, Bitcoin prices are decreasing with the markets.

Gold - S&P 500 and Bitcoin - S&P 500 correlations

To further highlight the di fferences, Fig. 5 visualizes the smoothed correlations of Gold and Bitcoin with the S&P 500. Interestingly, the movements in correlations appear to be mirrored from 2015 on, while being negative on average. This falls into the time where Bitcoin is becoming more popular and price increases begin to accelerate. From the joint plot, it becomes clear that Bitcoin, viewed as an asset, behaves di fferently than Gold. Comparing the correlations of Gold and Bitcoin with the MSCI World, plotted in the Appendix, the mirrored movements are more emphasized and span over diff erent signs.

Concluding our correlation analysis, we find Gold to be a hedge rather than a safe haven in recent years. Bitcoin, on the other hand, behaves completely di fferent, especially from 2015 on. The cryptocurrency couples with markets during bearish environments, with correlations rapidly turning to positive values in these times. This holds true for both the S&P 500 and the MSCI World index. We also observe inverse movements of correlations of Gold and Bitcoin with these two indices. While correlations increase for Gold, Bitcoin correlations decrease to the same market and vice versa. This is a clear indication that Bitcoin and Gold have di fferent connectedness to markets.

"


Are you looking for more strategies to read about? Check http://quantpedia.com/Screener

Do you want to see performance of trading systems we described? Check http://quantpedia.com/Chart/Performance

Do you want to know more about us? Check http://quantpedia.com/Home/About


Follow us on:

Facebook: https://www.facebook.com/quantpedia/

Twitter: https://twitter.com/quantpedia
Continue reading »

There Exist Two Different Accruals Anomalies

A new financial research paper related to:

#38 – Accrual Anomaly

Authors: Detzel, Schaberl, Strauss

Title: There are Two Very Different Accruals Anomalies

Link: https://papers.ssrn.com/sol3/papers.cfm?abstract_id=3069688

Abstract:

We document that several well known asset-pricing implications of accruals differ for investment and non-investment-related components. Exposure to an investment-accruals factor explains the cross-section of returns better than the accruals themselves, and this factor’s returns are negatively predicted by sentiment. The opposite results hold for non-investment accruals. Further tests show cash profitability only subsumes long-term non-investment accruals in the cross-section of returns and economy-wide investment accruals negatively predict stock-market returns while other accruals do not. These results challenge existing accruals-anomaly theories and help resolve mixed evidence by showing that the anomaly is two separate phenomena: a risk-based investment accruals premium and a mispricing of non-investment accruals.

Notable quotations from the academic research paper:

"To measure current-period performance with earnings, accountants add accruals to free cash flow that adjust for long-term investment expenditures and di fferences in timing between the earning and receipt of cash flows. The evidence in this paper shows that the asset-pricing implications of investment and non-investment components are fundamentally di fferent. These findings challenge existing theories of the accruals anomaly and demonstrate that there are not one, but two, accruals anomalies to explain: a risk-based premium for accruals that capture real investment, and a short-lived mispricing of accruals that capture transitory adjustments to profi tability.

Characteristics-vs-covariances tests show that an investment-accruals factor better explains the cross-section of returns than the investment accruals themselves. This result is evidence against earnings fixation and profitability-related mispricing explanations of the investment-accruals premium, which do not predict a factor structure of returns. In contrast, the opposite pattern holds for non-investment accruals, consistent with mispricing in the form of a violation of the law of one price. These results are corroborated by evidence that investment accruals predict the cross-section of returns for more than two years (consistent with persistent risk) while non-investment accruals only predict returns for one to eight months (consistent with short-lived mispricing).

While the investment-accruals premium is explained by a risk factor and is therefore not an arbitrage opportunity, the underlying factor is at least partially driven by sentiment as opposed to entirely rational demand. The negative investment-accruals premium is most signifi cant in times of high sentiment, which is consistent with firms responding to sentiment-induced overvaluation with high levels of real investment. In contrast, the negative non-investment-accruals premium is signifi cant only when sentiment is in its bottom quartile. This finding challenges existing mispricing explanations of accruals that do not predict that overvaluation of high-accruals fi rms should be
concentrated in low-sentiment periods. Moreover, the profi tability of non-investment accruals in low-sentiment times challenges the theory that anomaly returns should increase with sentiment because of the relative difficulty in arbitraging over-valuation.

Following Lewellen and Resutek (2016), we decompose total accruals into three components: working-capital accruals (WC), long-term investment accruals (IA), and long-term non-investment or "nontransaction" accruals (NTA). The IA component includes items such as new PP&E that represent expenditures in real investment. The WC and NTA include items such as accounts payable and receivable as well as depreciation that do not represent new long-term investment expenditures, but only transitory accounting adjustments to cash flows. Hence we refer to WC and NTA collectively as "non-investment accruals".

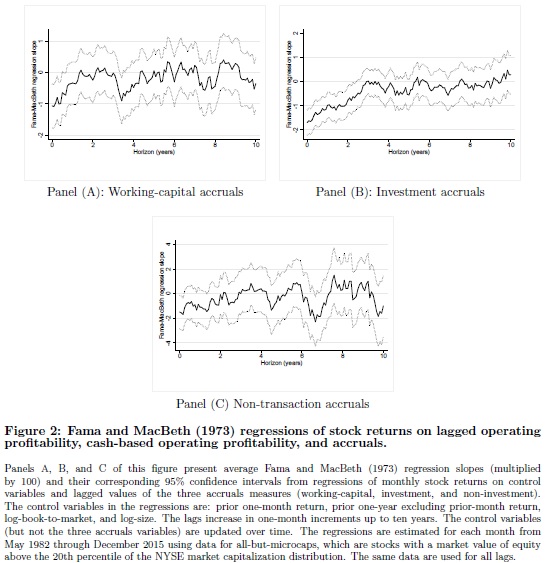
The Fama-Macbeth framework can provide additional evidence of risk versus mispricing. Ball et al. (2016) argue that risk should be more persistent than mispricing and investigate whether longer lags of OA and COP continue to predict returns in Fama-Macbeth regressions. Based on the same motivation, Figure 2 presents Fama-Macbeth regression slopes and their corresponding 95% confi dence intervals from regressions of monthly stock returns on control variables and lagged values of the three accruals measures (WC, IA, and NTA). Figure 2 demonstrates NTA and WC have the least persistent predictive power for returns. In contrast, IA is a more persistent predictor of
returns and remains signifi cant for up to 28 additional months. Overall, the evidence from Figure 2 is consistent with the IA premium arising from risk, whereas WC and NTA premia appear to be consistent with mispricing that is arbitraged away after several months.

pic 1

"


Are you looking for more strategies to read about? Check http://quantpedia.com/Screener

Do you want to see performance of trading systems we described? Check http://quantpedia.com/Chart/Performance

Do you want to know more about us? Check http://quantpedia.com/Home/About


Follow us on:

Facebook: https://www.facebook.com/quantpedia/

Twitter: https://twitter.com/quantpedia
Continue reading »

Quantpedia Update – 17th April 2018

Two new strategies have been added:

#386 – Enhanced Betting Against Beta Strategy in Equities
#387 – Moving Averages Distance Strategy in Equities

Two new related research papers have been included into existing strategy reviews. And two additional related research papers have been included into existing free strategy reviews during last 2 weeks.

Continue reading »

The Day of the Week Effect in the Crypto Currency Market

An interesting paper, an analysis of a day of the week effect in the crypto currency market … :

Authors: Caporale, Plastun

Title: The Day of the Week Effect in the Crypto Currency Market

Link: https://papers.ssrn.com/sol3/papers.cfm?abstract_id=3082117

Abstract:

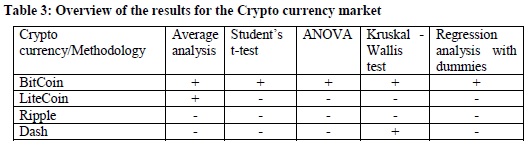
This paper examines the day of the week effect in the crypto currency market using a variety of statistical techniques (average analysis, Student's t-test, ANOVA, the Kruskal-Wallis test, and regression analysis with dummy variables) as well as a trading simulation approach. Most crypto currencies (LiteCoin, Ripple, Dash) are found not to exhibit this anomaly. The only exception is BitCoin, for which returns on Mondays are significantly higher than those on the other days of the week. In this case the trading simulation analysis shows that there exist exploitable profit opportunities that can be interpreted as evidence against efficiency of the crypto currency market.

Notable quotations from the academic research paper:

"There exists a vast literature analysing calendar anomalies (the Day of the Week Effect , theTurn of the Month Effect, the Month of the Year Effect, the January Effect, the HolidayEffect, the Halloween Effect etc.), and whether or not these can be seen as evidence againstthe Efficient Market Hypothesis. However, with one exception (Kurihara and Fukushima, 2017) to date no study has analysed such issues in the context of the crypto currency market – this being a newly developed market, it might still be relatively inefficient and it might offer more opportunities for making abnormal profits by adopting trading strategies exploiting calendar anomalies. We focus in particular on the day of the week effect, and for robustness purposes apply a variety of statistical methods (average analysis, Student's ttest, ANOVA, the Kruskal-Wallis test, and regression analysis with dummy variables) as well as a trading robot approach that replicates the actions of traders to examine whether or not such an anomaly gives rise to exploitable profit opportunities.

We examine daily data for 4 crypto currencies, choosing those with the highest market capitalisation and the longest data span (2013-2017), namely BitCoin, LiteCoin, Ripple and Dash. The data source is CoinMarketCap (https://coinmarketcap.com/coins/).

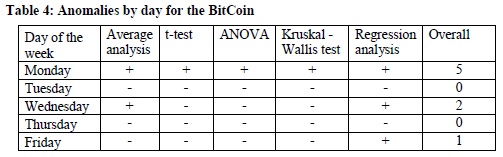
The complete set of results can be found in Appendix B. The results of the parametric and non-parametric tests are reported in Appendices C, D, E and F) and summarised in Table 3 and 4. There is clear evidence of an anomaly only in the case of BitCoin.

pic 1

pic 2

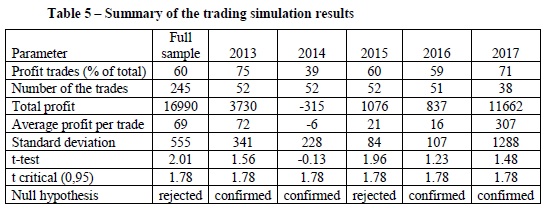
Since the anomaly occurs on Mondays (when returns are much higher than on the other days of the week) the trading strategy will be the following: open long positions on Monday and close them at the end of this day. The trading simulation results are reported in Table 5. In general this strategy is profitable, both for the full sample and for individual years, but in most cases the results are not statistically different from the random trading case, and therefore they do not represent evidence of market inefficiency.

pic 3

"


Are you looking for more strategies to read about? Check http://quantpedia.com/Screener

Do you want to see performance of trading systems we described? Check http://quantpedia.com/Chart/Performance

Do you want to know more about us? Check http://quantpedia.com/Home/About


Follow us on:

Facebook: https://www.facebook.com/quantpedia/

Twitter: https://twitter.com/quantpedia
Continue reading »