
Solvency Risk Premia and the Carry Trades

A new financial research paper related to:

#5 – FX Carry Trade

Authors: Orlov

Title: Solvency Risk Premia and the Carry Trades

Link: https://papers.ssrn.com/sol3/papers.cfm?abstract_id=3116031

Abstract:

This paper shows that currency carry trades can be rationalized by the time-varying risk premia originating from the sovereign solvency risk. We find that solvency risk is a key determinant of risk premia in the cross section of carry trade returns, as its covariance with returns captures a substantial part of the cross-sectional variation of carry trade returns. Importantly, low interest rate currencies serve as insurance against solvency risk, while high interest rate currencies expose investors to more risk. The results are not attenuated by existing risks and pass a broad range of various robustness checks.

Notable quotations from the academic research paper:

"Overall, the cumulative evidence points to time-varying risk premia as the pervasive source of the carry trade returns and to the forward premium puzzle not being without costs. Nonetheless, the identification of an appropriate risk premia that explains the carry trade profitability remains an ongoing debate. This paper provides new evidence in favor of sovereign solvency being a potential source of risk in currency market.

This paper contributes to current debate by revealing a new economic-based time-varying risk premia in the currency market that depends upon a country’s solvency. We argue that the financial capacity of the economy, captured by the solvency measures, incites the differences in average carry trade excess returns. In other words, the profitability of currency carry trades can be rationalized by the time-varying risk premia that originate from the sovereign solvency risk. Consistently, we find that high interest rate currencies demand a higher risk premium, as they deliver low carry trade returns at times of high solvency risk, therefore exposing investors to more risk, whereas low interest currencies are a hedge against the solvency risk.

In this paper we assume risk premium is a function of financial solvency of the economy, defined by either a ratio of foreign debt to economy’s earning ability (henceforth, the solvency measure), or a ratio of balance of the current account to the estimated aggregate of total exports of goods and services, or aggregated financial solvency index. Risk premium is then represented by an increasing convex function of one of these measures. In the most of our analysis, we consider external debt service capacity measured by the gross foreign debt-to-output ratio as a measure of solvency of the country.

We perform portfolio sorts on forward discounts and the solvency measure, identify risk factor as the returns on zero-cost long-short strategy between the last and first solvency-sorted portfolios and label it IMS, for indebted-minus-solvent economies. The IMS factor explains the substantial part of the cross-sectional variation in carry trade portfolios, exhibiting monotonically increasing factor loadings and significant prices of risk, consistent with risk premia explanation. Moreover, the factor is empirically powerful in various model specifications and sample splits, prices different test assets, stands out horse races with other currency-specific risk factors, robust against an alternative funding currency (the Japanese Yen) and alternative solvency measure specifications, and passes several other robustness checks. Taken collectively pointing to the solvency risk factor being an effective tool for pricing the cross-section of carry returns."


Are you looking for more strategies to read about? Check http://quantpedia.com/Screener

Do you want to see performance of trading systems we described? Check http://quantpedia.com/Chart/Performance

Do you want to know more about us? Check http://quantpedia.com/Home/About
Continue reading »

Quantpedia Update – 2nd March 2018

Four new strategies have been added:

#378 – Momentum Factor in Cryptocurrencies
#379 – Carry Factor in Cryptocurrencies
#380 – Value Factor in Cryptocurrencies
#381 – Blended Factors in Cryptocurrencies

One new related research paper has been included into existing strategy reviews. And two additional related research papers have been included into existing free strategy reviews during last 2 weeks.

Continue reading »

Systematic Interventions of Central Banks and Major Currency Risk Factors

Related to all major currency risk premiums:

#5 – FX Carry Trade
#8 – FX Momentum
#9 –
FX Value – PPP Strategy

Authors: Fratzcher, Menkhoff, Sarno, Schmeling, Stoehr

Title: Systematic Intervention and Currency Risk Premia

Link: https://papers.ssrn.com/sol3/papers.cfm?abstract_id=3119907

Abstract:

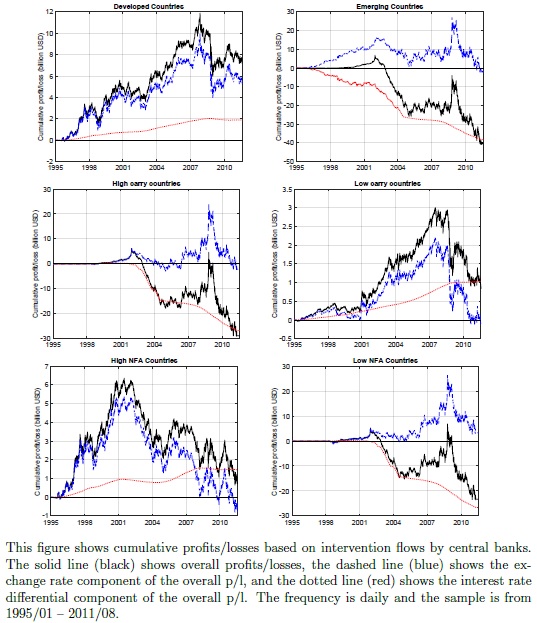
Using data for the trades of 19 central banks intervening in currency markets, we show that leaning against the wind by individual central banks leads to "systematic intervention" in the aggregate central banking sector. This systematic intervention is driven by and impacts on the same factors that drive currency excess returns: carry, momentum, value, and a dollar factor. The sensitivity of an individual central bank's intervention to these factors differs markedly across countries, with developed countries making a profit from intervention and emerging markets incurring large losses.

Notable quotations from the academic research paper:

"A large literature has documented that the cross-section of currency excess returns is predictable, and that currency risk premia can be captured through straightforward investment strategies. These includes, inter alia, carry trades that buy high interest rate currencies and sell low interest rate currencies, dollar strategies that short the US dollar (USD) and buy a diversi fied portfolio of foreign currencies, momentum strategies that buy currencies that appreciated in the recent past and short those that depreciated in the recent past, and value strategies that buy undervalued currencies and sell overvalued currencies.

However, the FX market is populated by a large and diverse set of players, some of which are not necessarily motivated by getting exposure to these risk factors or by profi ting through FX trading, most notably central banks.

From a nance perspective, a number of interesting questions arise in this market setting in relation to whether and how central bank intervention across countries is related to the factors that drive the cross-section of currency excess returns: Are aggregate central bank interventions driven by the same set of factors that drive exchange rates? Do the trading actions of central banks, i.e., their FX intervention flows, aff ect currency risk premia and, if so, do they increase or decrease excess returns from popular currency strategies? Do central banks profi t or lose money from their intervention operations? These are the questions that we address in this paper.

We tackle these questions empirically using the data on daily sterilized interventions in the FX market. Speci cally, we use a subset of their data since we study interventions against the US dollar (USD) only, and we limit the sample of currencies to countries with (relatively) flexible exchange rate regimes and few or no capital controls. We study a cross-section of interventions in 19 exchange rates (all against the USD) by aggregating the interventions of the 19 associated central banks over the sample from 1995 to 2011.

We find that:

(i) there is a strong factor structure in interventions, which we call "systematic intervention", that is closely related to the factor structure in exchange rates;

(ii) central banks tend to intervene in support of a factor (carry, momentum, value, and/or dollar) when returns to that factor are low and vice versa;

(iii) as a corollary, central bank interventions are signi ficantly di fferent across di fferent market states;

(iv) there are signi ficant di fferences across country subgroups (developed versus emerging markets, high versus low interest rate countries, high versus low net foreign asset positions);

(v) emerging countries lose money on their intervention activity and the bulk of these losses is driven by the hefty interest rate di fferential they face when they sell their currencies to buy the USD;

(vi) a simple price impact analysis suggests that global, systematic interventions by the aggregate central banking sector are large enough to move exchange rates by a signi ficant amount and, for example, interventions to support carry in the aftermath of the global fi nancial crisis lifted carry returns by about 5 percent.

pic1

Conditional analysis reveals that in normal times, which are typically characterized by normal or relatively low volatility and positive carry trade returns, central banks trade against carry, whereas in bad times when carry returns typically fall sharply, there is systematic intervention in support of carry (high interest currencies). These e ffects are particularly strong for emerging markets, countries with high interest rates, and countries with low net foreign asset positions. In essence, the "leaning against the wind" nature of intervention activities curbs carry profi ts for the investment community during good times, but helps reducing the carry losses in bad times, e ffectively smoothing carry returns. A similar mechanism applies to the other factors. Speci fically, systematic intervention is almost always against momentum and the dollar factor (i.e., the central banking sector is a net buyer of the US dollar), but this e ffect is much stronger in terms of intervention amounts at times of market turmoil. Hence, from the viewpoint of these factors, central banks don't just lean against momentum but also against the carry and dollar factor. Finally, systematic intervention is almost always in the direction of value (i.e., the central banking sector tends to act to curb exchange rate misalignments), but this e ffect is much more pronounced at times of market turmoil."


Are you looking for more strategies to read about? Check http://quantpedia.com/Screener

Do you want to see performance of trading systems we described? Check http://quantpedia.com/Chart/Performance

Do you want to know more about us? Check http://quantpedia.com/Home/About

Continue reading »

Mixed Copula Pairs Trading Strategy

A new financial research paper related to:

#12 – Pairs Trading with Stocks

Authors: da Silva, Ziegelman, Caldeira

Title: Pairs Trading: Optimizing via Mixed Copula versus Distance Method for S&P 500 Assets

Link: https://papers.ssrn.com/sol3/papers.cfm?abstract_id=3070950

Abstract:

We carry out a study to evaluate and compare the relative performance of the distance and mixed copula pairs trading strategies. Using data from the S&P 500 stocks from 1990 to 2015, we find that the mixed copula strategy is able to generate a higher mean excess return than the traditional distance method under different weighting structures when the number of tradeable signals is equiparable. Particularly, the mixed copula and distance methods show a mean annualized value-weighted excess returns after costs on committed and fully invested capital as high as 3.98% and 3.14% and 12.73% and 6.07%, respectively, with annual Sharpe ratios up to 0.88. The mixed copula strategy shows positive and significant alphas during the sample period after accounting for various risk-factors. We also provide some evidence on the performance of the strategies over different market states.

Notable quotations from the academic research paper:

"Currently, there are three main approaches for pairs trading: distance, cointegration and copula. The traditional distance method has been widely researched and tested throughout the pairs trading literature. However, this approach only captures dependencies well in the case of elliptically distributed random variables. This assumption is generally not met in practice, motivating the utilization of copula-based models to address the univariate and multivariate stylized facts for multivariate financial return stocks. Nevertheless, the use of copulas in this context is still recent and needs more comprehensive and profound studies.

In this paper, we will conduct an empirical investigation to offer some evidence of the behavior of the distance and mixed copula strategies. We propose, differently from Rad, Low, and Faff (2016) and Xie, Liew, Wu, and Zou (2016), a mixed copula-based strategy to capture linear and nonlinear associations and at the same time cover a wider range of possible dependence structures. We aim to assess whether building a more sophisticated model can take advantage of any market frictions or anomalies uncovering relationships and patterns. We find that the mixture copula strategy is able to generate a higher mean excess return than the distance method when the number of trading signals is equiparable. We also want to investigate the sensitivity of the copula method to different opening thresholds and how trading costs affect the profitability of these strategies.

Our strategy consists in fitting, initially, the daily returns of the formation period using an ARMA(p,q)- GARCH(1,1) to model the marginals. For each pair, we test the following elliptical and Archimedean copula functions: Gaussian, t, Clayton, Frank, Gumbel, one Archimedean mixture copula consisting of the optimal linear combination of Clayton, Frank and Gumbel copulas and one mixture copula consisting of the optimal linear combination of Clayton, t and Gumbel copulas.

We compare the performance out-of-sample of the strategies using a variety of criteria, all of which are computed using a rolling period procedure similar to that used by Gatev, Goetzmann, and Rouwenhorst (2006) with the exception that the time horizon of formation and trading periods are rolled forward by six months. The main criteria we focus on are: (1) mean and cumulative excess return, (2) risk-adjusted metrics as Sharpe and Sortino ratios, (3) percentage of negative trades, (4) t-values for various risk factors, and (5) maximum drawdown between two consecutive days and between two days within a maximum period of six months.

Figure 3 shows cumulative excess returns through the full dataset for both strategies for Top 5 (top), Top 20 (center) and Top 35 (bottom) pairs. The left panels display cumulative returns on committed capital, whereas the right panels on fully invested capital.

The main findings when the number of trading signals is equiparable are summarized below.

1. The mixed copula strategy is able to generate a higher mean excess return and a Sharpe ratio over twice as much as what we get from investing in the traditional distance method after trading costs.

2. The mixed copula approach delivers economically larger alphas than the distance method for both weighting schemes (10 and 58 bps per month on committed and fully invested capital, respectively) after transaction costs, suggesting the importance of the proposed method. It should also be noted that the alphas provided by mixed copula and distance strategies are significant at 1% and 10%, respectively, after accounting for several asset pricing factors such as momentum, liquidity, profitability and investment. Thus, the results show that the profits are not fully explained by the other factors.

3. As it can be observed, the right-hand-side tail (of positive outcomes) of the density of the five-year Sharpe ratio is longer for the mixed copula strategy, implying that the copula-based strategy has a better risk adjusted performance than the distance approach.

4. The share of days with negative excess returns is smaller for the mixed copula approach (41.79%) than for the distance strategy (46.98%) and the market performance (47.45%).

5. Neither strategy consistently shows superiority over all subperiods, at least on committed capital. Overall, the mixed copula strategy shows a superior out-of-sample performance relative to the distance approach in the second and third subperiods (1996-2000 and 2001-2005) and after the subprime mortgage crisis (2011-2015), while the distance method delivers a significant better performance in the first (1991-1995) and fourth subperiods (2006-2010) on committed capital."


Are you looking for more strategies to read about? Check http://quantpedia.com/Screener

Do you want to see performance of trading systems we described? Check http://quantpedia.com/Chart/Performance

Do you want to know more about us? Check http://quantpedia.com/Home/About
Continue reading »

Quantpedia Update – 15th February 2018

Two new strategies have been added:

#376 – Combining Fundamental FSCORE and Equity Short-Term Reversals
#377 – Trading Futures Using Basis Indicator

One new related research paper has been included into existing strategy reviews. And three additional related research papers have been included into existing free strategy reviews during last 2 weeks.

Continue reading »

Price Overreactions in the Cryptocurrency Market

Once again, is cryptocurrency market efficient? Or can we find simple trading strategies based on price overreactions? :

Authors: Caporale, Plastun

Title: Price Overreactions in the Cryptocurrency Market

Link: https://papers.ssrn.com/sol3/papers.cfm?abstract_id=3088472

Abstract:

This paper examines price overreactions in the case of the following cryptocurrencies: BitCoin, LiteCoin, Ripple and Dash. A number of parametric (t-test, ANOVA, regression analysis with dummy variables) and non-parametric (Mann–Whitney U test) tests confirm the presence of price patterns after overreactions: the next-day price changes in both directions are bigger  than after “normal” days. A trading robot approach is then used to establish whether these statistical anomalies can be exploited to generate profits. The results suggest that a strategy based on counter-movements after overreactions is not profitable, whilst one based on inertia appears to be profitable but produces outcomes not statistically different from the random ones. Therefore the overreactions detected in the cryptocurrency market do not give rise to exploitable profit opportunities (possibly because of transaction costs) and cannot be seen as evidence against the Efficient Market Hypothesis (EMH).

Notable quotations from the academic research paper:

"Despite a significant number of studies on market overreactions none of them has focused on the cryptocurrency market, which is the most volatile among financial markets: the average daily price amplitude in this market is more than 10 times higher than in FOREX, 7 times higher than in stock market and more than 5 times higher than in the commodity markets. This feature (combined with the fact that it is a very young market) makes it particularly interesting to examine for possible overreactions.

This paper provides new evidence on the overreaction anomaly in the cryptocurrency market by testing the following two hypotheses: after one-day abnormal price movements (overreactions), on the next day abnormal price (i) counter-movements or (ii) momentum movements are observed. For this purpose, a number of statistical tests (both parametric and non-parametric) are carried out. A trading robot approach is then used to investigate whether any detected anomalies generate exploitable profit opportunities. The analysis is carried out for four different cryptocurrencies (BitCoin, LiteCoin, Ripple and Dash).

Empirical Results: analysis confirms the presence of a statistical anomaly in price dynamics in the cryptocurrency market after overreaction days price changes in both directions (in the direction of overreaction and counter movement) are bigger than after normal days.

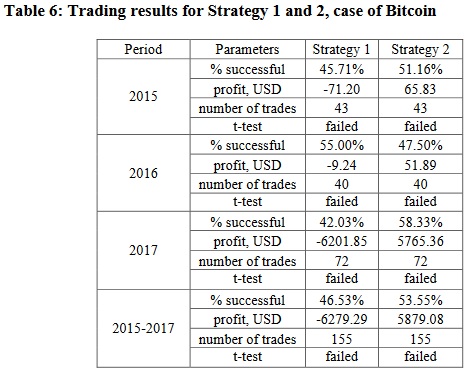
Next we test whether these anomalies can be exploited to make abnormal profits by using a trading robot approach and considering 2 trading strategies. Strategy 1 is based on the standard overreaction anomaly: there are abnormal counter-reactions after the overreaction day. The trading algorithm in this case is specified as follows: the cryptocurrency is sold (bought) on the open price of the day after the overreaction if an abnormal price increase
(decrease) has occurred. The open position is closed at the end of the day when it was opened. Strategy 2 is based on the momentum effect, the so-called “inertia anomaly”: there are abnormal price movements in the direction of the overreaction on the following  day. The trading algorithm is specified as follows: after the overreaction day the cryptocurrency is sold (bought) on the open price of the day after the overreaction if an abnormal price decrease (increase) has occurred. Again, an open position is closed at the end of the day when it was opened.

BitCoin prices are used for the analysis (data availability motivated this choice) for the years 2015, 2016, 2017 in turn and then for the whole period 2015-2017.

As can be seen, the results of Strategy 1 are rather stable and in general imply a lack of exploitable profit opportunities from trading based on counter-movements after overreactions in the cryptocurrency market. This applies to all periods. The t-test statistics indicate that the   results are not significantly different from the random ones (see Appendix F for details); indirect evidence for this is also provided by the number of profitable trades, which is close to 50%. By contrast, Strategy 2 generates profits in each individual year as well as the full sample, but the results are not significantly different from the random ones (as implied by the t-test statistics). The number of profitable trades is close to 50%. Overall, trading based on the “inertia” anomaly cannot be considered profitable."


Are you looking for more strategies to read about? Check http://quantpedia.com/Screener

Do you want to see performance of trading systems we described? Check http://quantpedia.com/Chart/Performance

Do you want to know more about us? Check http://quantpedia.com/Home/About

Continue reading »













