
A new financial research paper has been published and is related to:
#31 – Market Seasonality Effect in World Equity Indexes
#41 – Turn of the Month in Equity Indexes
#75 – Federal Open Market Committee Meeting Effect in Stocks
Autores: Hull, Bakosova, Kment
Título: Seasonal Effects and Other Anomalies
Link: https://papers.ssrn.com/sol3/papers.cfm?abstract_id=3165669
Abstracto:
We revisit a series of popular anomalies: seasonal, announcement and momentum. We comment on statistical significance and persistence of these effects and propose useful investment strategies to incorporate this information. We investigate the creation of a seasonal anomaly and trend model composed of the Sell in May (SIM), Turn of the Month (TOM), Federal Open Market Committee pre-announcement drift (FOMC) and State Dependent Momentum (SDM). Using the total return S&P 500 dataset starting in 1975, we estimate the parameters of each model on a yearly basis based on an expanding window, and then proceed to form, in a walk forward manner, an optimized combination of the four models using a return to risk optimization procedure. We find that an optimized strategy of the aforementioned four market anomalies produced 9.56% annualized returns with 6.28% volatility and a Sharpe ratio of 0.77. This strategy exceeds that Sharpe ratio of Buy-and-Hold in the same period by almost 100%. Furthermore, the strategy also adds value to the previously published market-timing models of Hull and Qiao (2017) and Hull, Qiao, and Bakosova (2017). A simple strategy which combines all three models more than doubles the Sharpe ratio of Buy-and-Hold between 2003-2017. The combined strategy produces a Sharpe ratio of 1.26, with annualized returns of 18.03% and 13.26% volatility. We publish conclusions from our seasonal trend and anomaly model in our Daily Report.
Fragmentos destacados del artículo de investigación académica:
"In this paper we combine seasonal anomalies, Fed announcement and trend in a walk forward way. Numerous papers present compelling evidence on seasonal effects of the market, with Turn of the Month and the Halloween effect being the most convincing. At the same time there appears to be an excess return prior to Fed meetings. We combine these effects with the new trend indicator to create an effectiv emodel that beats Buy-and-Hold. This Seasonal Anomaly and Trend Model is then combined in an ensemble with other market timing models into an even more powerful strategy.
We start with four robust seasonal anomalies, and propose a simple deterministic trading strategy for each. Then we introduce a few different options of combining these four strategies. First, we look at the mean-variance optimization algorithm (Markowitz 1952), and second, we perform a grid search on model weights to look for optimal combination of signals rather than using portfolio optimization. Last, we also consider a simple equal weight portfolio for comparison. The results are as follows. From 1976 to 2017, the equally weighted model produces the highest Sharpe ratio (0.89 compared to 0.77 of the grid search algorithm and 0.80 for the mean-variance algorithm). However, the grid search model produces the highest Sharpe ratio of 0.84 in more recent period (1996-2017), compared to 0.82 and 0.78 for equal weight and mean-variance algorithm respectively. The univariate strategies are restricted to be between 0% and 150% invested in S&P 500, with the exception of the trend model which is capped between -50% and 150%. We maximize the backtested Sharpe ratio in our analysis, since this metric is rather invariant to scaling. Investors wishing to deploy these models in their portfolios can subsequently choose their level of leverage based on their risk preferences.
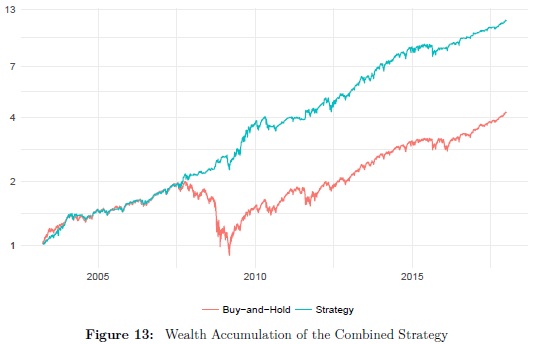
The seasonal trend model also enhances the market-timing models of Hull and Qiao (2017) and Hull, Qiao, and Bakosova (2017). A simple strategy which combines all three models almost triples the Sharpe ratio of Buy-and-Hold between 2003-2017. The combined strategy produces a Sharpe ratio of 1.26, with annualized returns of 18.03% and 13.26% volatility.
Figure 13 shows the wealth accumulation of the combined strategy relative to Buy-and-Hold. The outperformance is not economically significant in the bull market of the early 2000s but becomes more pronounced in the volatile period during the Global Financial Crisis (GFC) and in the jittery markets of 2011-2012.
"
Quantpedia & Genovest cooperation
We started a very interesting cooperation with a guys from Genovest. They started to analyze some of Quantpedia's suggested strategies. The first article analyzes a well-known Graham's Net Current Asset Value strategy and shows that the strategy has not lost its outperformance during the last few years:
https://genovest.com/blog/putting-quantpedia-to-the-test/
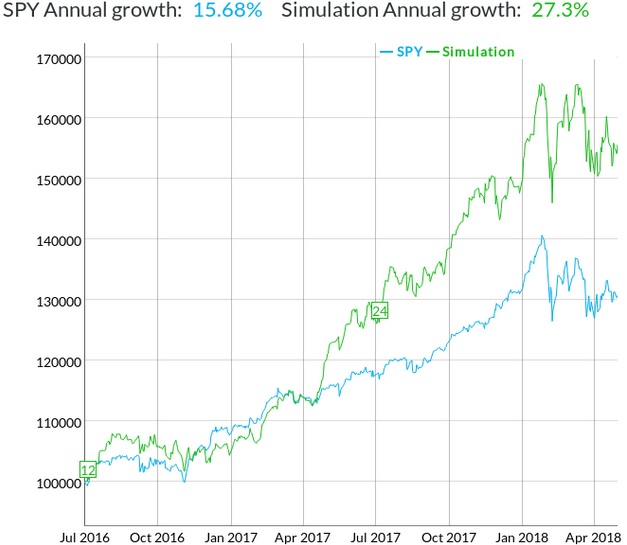
The strategy's rules are really simple. Investor only buy stocks with NCAV (net current asset value, as defined by Graham, is current assets minus all liabilities, divided by the number of shares outstanding) over 1.5, exclude lightly-regulated companies, and exclude companies in the financial sector. The portfolio of stocks is formed annually in July, and held for one year with equal weighting.
We are looking forward to any new strategy's backtest …
¿Buscas más estrategias para leer? Suscríbete a nuestro boletín informativo o visite nuestra Blog o Evaluador.
¿Quieres saber más sobre el servicio Quantpedia Premium? Consulta Cómo funciona Quantpedia, nuestra misión y Oferta de precios premium.
¿Quieres saber más sobre el servicio Quantpedia Pro? Compruébalo descripción, mirar videos, revisar capacidades de generación de informes y visite nuestro oferta de precios.
¿Buscas datos históricos o plataformas de backtesting? Consulta nuestra lista de Descuentos en Algo Trading.
¿Te gustaría tener acceso gratuito a? nuestros servicios? Entonces, Abre una cuenta con Lightspeed. y disfrute de un año de Quantpedia Premium sin costo alguno.
O síguenos en:
Facebook Grupo, Facebook Página, Gorjeo, LinkedIn, Medio o YouTube