Robert Shiller and Farouk Jivraj discuss a validity of methodology for Campbell &Shiller’s CAPE ratio calculation, share their opinion on future returns of US equities and give few novel ideas for CAPE’s usage for asset allocation and country and sector picking:
Autores: Jivraj, Shiller
Título: The Many Colours of CAPE
Link: https://papers.ssrn.com/sol3/papers.cfm?abstract_id=3258404
Abstracto:
Campbell & Shiller’s [1988] Cyclically-Adjusted Price to Earnings ratio (CAPE) has both its advocates and critics. Currently, the debate is on the validity of the high CAPE ratio for US stock markets in forecasting lower future returns, with CAPE currently at 31.21. We investigate the efficacy and validity of CAPE from several different perspectives. First, we run multiple-horizon predictability regressions for CAPE versus its peers and find that CAPE consistently displays economic and statistical significance far better than any of its peers. Second, we explore alternative constructions of CAPE based on other proxies for earnings motivated by the work of findings by Siegel [2016] using NIPA profits. We find that original CAPE is still best when comprehensively and fairly reviewing the other proxies, even for NIPA profits. Third, we assess how to practically use CAPE in both an asset allocation and relative valuation setting. We demonstrate a novel use of CAPE for asset allocation programmes as well as discuss relative valuation exercises for country, sector and single stock rotation.
Fragmentos destacados del artículo de investigación académica:
“Campbell & Shiller’s Cyclically-Adjusted Price to Earnings ratio (CAPE), is a well known to characterize the strong relationship between an inflation adjusted earnings-to-price ratio and subsequent longterm returns. As a result, it has now become an often cited measure of equity market valuation. With such a status, the current value of CAPE, 31.12 (as in 10/2017), is causing concern amongst investors and spurring debate among academics – it is currently in 96th percentile compared to its own history since 1881. Thus, the question of whether the US stock market is overpriced, is being hotly contested and CAPE is at the centre of this debate.
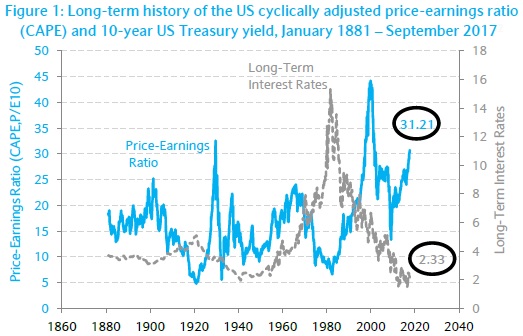
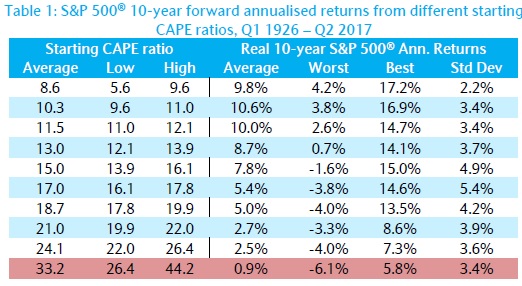
Table 2 shows, that historically, at such a starting level, by deciles, we’re in the worst possible bucket where on average subsequent annualised real returns over next ten years were a mere 0.9%, with the best case being a not bad 5.8% but the worst case being a very bad -6.1%
Critics mainly focus on ways to claim that the observed CAPE ratios are too high and not valid for reasons such as statistical significance and/or changing accounting standard over the years.
Siegel (2016) proposed an alternative of National Income and Product Account (NIPA) corporate profits from the Bureau of Economic Analysis to be used in context of correcting the bias in CAPE. We therefore look closely at these claims but also compliment this alternative CAPE constrution using NIPA profits, with version using operating earnings, cash flow, sales and book value as other earnings related proxies.
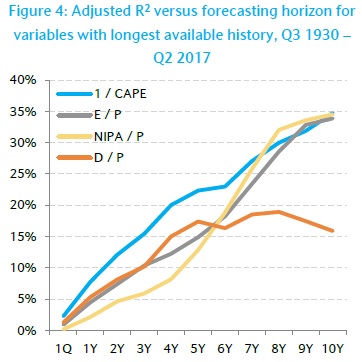
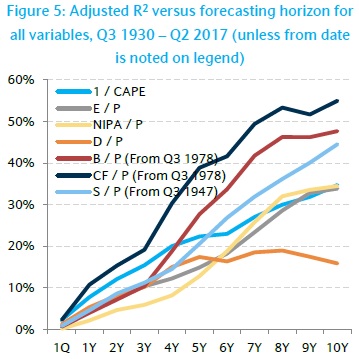
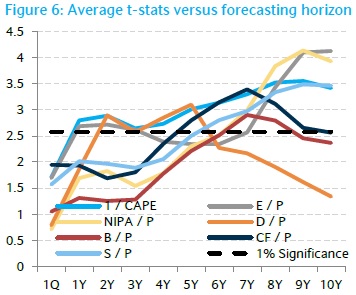
Figures 4 to 6 report R^2 and averaged t-statistics for our predictability regressions. They should be reviews in tandem. Figure 4 demonstrates the ability of CAPE in forecasting returns better then E/P, NIPA/P and D/P at shorter horizons. E/P and NIPA/P eventually catch up and significantly so, as confirmed by their t-statistics in Figure 6. However it is clear, that CAPE is able to consistently predict subsequent returns significantly so from a 1Y horizon onwards.
Figure 6 perfectly highlights the small sample bias in long horizon regressions when comparing the R^2s of B/P, CF/P and S/P with those in figure 5. Whilst the R^2s may appear higher, especially at the longest horizons, Figure 6 shows that past a 5Y horizon, S/P is the only variable that is consistently significant.
”
¿Buscas más estrategias para leer? Suscríbete a nuestro boletín informativo o visite nuestra Blog o Evaluador.
¿Quieres saber más sobre el servicio Quantpedia Premium? Consulta Cómo funciona Quantpedia, nuestra misión y Oferta de precios premium.
¿Quieres saber más sobre el servicio Quantpedia Pro? Compruébalo descripción, mirar videos, revisar capacidades de generación de informes y visite nuestro oferta de precios.
¿Buscas datos históricos o plataformas de backtesting? Consulta nuestra lista de Descuentos en Algo Trading.
¿Te gustaría tener acceso gratuito a? nuestros servicios? Entonces, Abre una cuenta con Lightspeed. y disfrute de un año de Quantpedia Premium sin costo alguno.
O síguenos en:
Facebook Grupo, Facebook Página, Gorjeo, LinkedIn, Medio o YouTube
