
Hello all,
The Sharpe Ratio and correlation measure are both important metrics in evaluating investment strategies. Each of those ratios can be used independently to compare competing strategies, but using them individually, in isolation, has a lot of disadvantages. The true power is hidden in the combination of them.
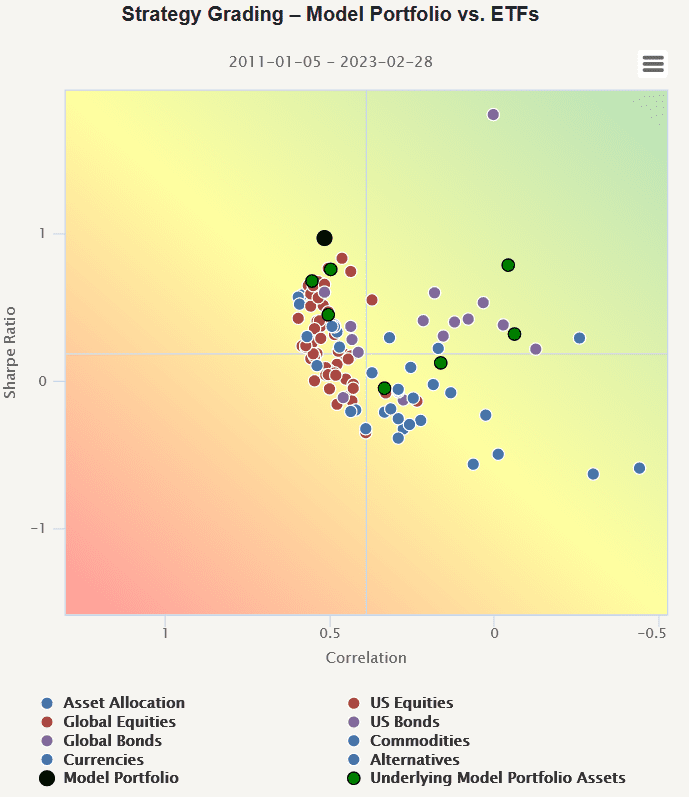
The new Quantpedia Pro’s February addition – the Strategy Grading report consists of 2 dotted charts. Each of them displays the universe of investment strategies; the first chart shows ETFs, and the second chart strategies backtested by Quantpedia. The X-axis measures the Sharpe ratio, and Y-axis measures the average correlation of each particular strategy against peers. Additionally, in each chart, the Model Portfolio, together with its individual constituents, is projected.
What are the Strategy Grading charts depicting?
Dots (ETFs/strategies) that are located more in the top right corner are the ones that were the most valuable for the portfolio construction over the selected time period. They had the highest risk-adjusted performance (Sharpe ratio measure) and the lowest correlation to all of the other peers. On the other hand, dots that are located more in the bottom left corner were less useful from the perspective of the portfolio construction.
How can we use this report in the day-to-day portfolio management workflow?
A location of the dot that represents the selected Model Portfolio shows how it fares against its peers (be it ETFs or systematic trading strategies). We can see which ETFs/strategies can be a useful addition to the portfolio (those that are located more to the top right corner), and if we analyze the individual components of the portfolio, we can also see which were detrimental to the overall risk-return characteristic of the Model Portfolio.
Let’s also quickly recapitulate Quantpedia Premium development:
- 10 new Quantpedia Premium strategies have been added to our database
- 11 new related research papers have been included in existing Premium strategies during the last month
- 7 new backtests were written in QuantConnect code. Our database currently contains over 640 strategies with out-of-sample backtests/codes.
Additionally, 5 new articles were published on the Quantpedia blog in the previous month, 3x analysis of academic research paper and 2x Quantpedia study:
- Investigating Price Reaction Around Bitcoin & Ethereum Events
- Evaluating Long-Term Performance of Equities, Bonds, and Commodities Relative to Strength of the US Dollar
And here are links to 3x analysis of research papers:
How to Deal With Missing Financial Data
Authors: Svetlana Bryzgalova, Sven Lerner, Martin Lettau and Markus Pelger
Title: Missing Financial Data
Time Series Variation in the Factor Zoo
Autores: Hendrik Bessembinder, Aaron Burt, and Christopher M. Hrdlicka
Título: Time Series Variation in the Factor Zoo
An Investor’s Guide to Cryptocurrencies
Autores: Harvey, Campbell R. and Abou Zeid, Tarek and Draaisma, Teun and Luk, Martin and Neville, Henry and Rzym, Andre and van Hemert, Otto
Título: An Investor’s Guide to Crypto
Yours …
Radovan Vojtko
CEO & Head of Research
¿Buscas más estrategias para leer? Suscríbete a nuestro boletín informativo o visite nuestra Blog o Evaluador.
¿Quieres saber más sobre el servicio Quantpedia Premium? Consulta Cómo funciona Quantpedia, nuestra misión y Oferta de precios premium.
¿Quieres saber más sobre el servicio Quantpedia Pro? Compruébalo descripción, mirar videos, revisar capacidades de generación de informes y visite nuestro oferta de precios.
¿Buscas datos históricos o plataformas de backtesting? Consulta nuestra lista de Descuentos en Algo Trading.
¿Te gustaría tener acceso gratuito a? nuestros servicios? Entonces, Abre una cuenta con Lightspeed. y disfrute de un año de Quantpedia Premium sin costo alguno.
O síguenos en:
Facebook Grupo, Facebook Página, Gorjeo, LinkedIn, Medio o YouTube