
Quantpedia is The Encyclopedia of Quantitative Trading Strategies
We've already analyzed tens of thousands of financial research papers and identified more than 1000 attractive trading systems together with thundreds of related academic papers.
- Unlock Screener & 300+ Advanced Charts
- Browse 1000+ uncommon trading strategy ideas
- Get new strategies on bi-weekly basis
- Explore 2000+ academic research papers
- View 800+ out-of-sample backtests
- Design multi-factor multi-asset portfolios
A very few stock market anomalies are documented as well as the momentum effect. The momentum effect has not disappeared (or weakened) even after the strategy was made publicly known. Momentum interacts very well with other market anomalies, and a combined strategy is usually more successful than its parts.
The firm-level asset expansion (measured as the growth in balance sheet total assets) is one such partner. Academic research shows that momentum profits are especially strong and are highly statistically significant for stocks with high past asset growth. The positive relationship between asset growth and momentum remains strong even after adjustments for the market value of equity, book-to-market, share turnover, return volatility, or credit rating.
Fundamental reason
Academic research shows that the existing literature does not offer clear answers as to why firm investment, measured by asset growth, should be connected to return continuation. However, results from this academic study are highly statistically significant and based on a long data sample. The interaction between asset growth and momentum survives the inclusion of the number of control variables. Confidence in this combined strategy, therefore, could be high.
Get Premium Strategy Ideas & Pro Reporting
- Unlock Screener & 300+ Advanced Charts
- Browse 1000+ unique strategies
- Get new strategies on bi-weekly basis
- Explore 2000+ academic research papers
- View 800+ out-of-sample backtests
- Design multi-factor multi-asset portfolios
Keywords
Strategy profile
- Market factors
- Equities
- Financial instruments
- Stocks
- Regions
- United States
- Number of traded instruments
- 1000
more or less, it depends on investor's need for diversification
- Complexity
- Complex
- Rebalancing period
- Monthly
- Confidence in anomaly's validity
- Strong
- Transaction costs
- Not Reported
- Robustness checks
- Assessed
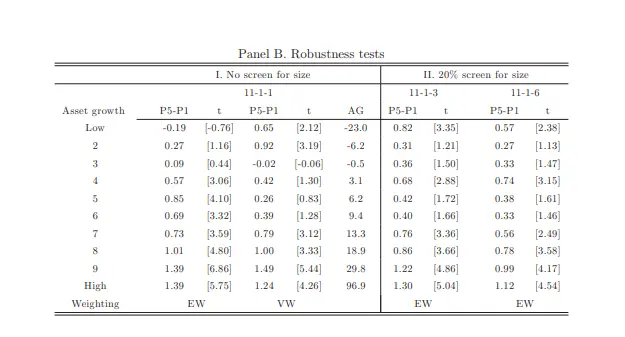
The asset-growth-conditioned 11-1 momentum result is tested with 3- and 6-month overlapping holding periods, without the size screen, and after excluding firms rated below B (Table II, Panels B–C); the high-asset-growth momentum effect remains strong, although the low-asset-growth effect dissipates more quickly at longer horizons. Independent sorts and Fama–MacBeth regressions control for size, book-to-market, turnover, idiosyncratic volatility, credit rating, and past-return dispersion (Table III and Internet Appendix), and the asset-growth interaction remains significant. Further tests control for profitability/CNZ factors, expected-growth risk, and macroeconomic exposures (Table VI and Internet Appendix); these reduce but do not fully explain the interaction. The result also appears across expansion/recession, up/down-market, and sentiment states (Table IV), with the January 2001 exclusion reported only for the separate down-market analysis.
Source-paper performance
- Backtest period
- 1968 – 2006
- Indicative performance
- 16.77%
per annum, annualized (geometrically) monthly return 1,3%, data from table 2 panel B-II for long short strategy which excludes January
- Estimated volatility
- 13.84%
estimated from t-statistic (5.04) from table 2 panel B-II
- Maximum drawdown
- -88.95%
not stated
- Sharpe ratio
- 1.21
Simple trading strategy
The investment universe consists of NYSE, AMEX, and NASDAQ stocks (data for the backtest in the source paper are from Compustat). Stocks with a market capitalization less than the 20th NYSE percentile (smallest stocks) are removed. The asset growth variable is defined as the yearly percentage change in the balance sheet total assets. Data from year t-2 to t-1 are used to calculate asset growth, and July is the cut-off month. Every month, stocks are then sorted into deciles based on asset growth, and only stocks with the highest asset growth are used. The next step is to sort stocks from the highest asset growth decile into quintiles, based on their past 11-month return (with the last month's performance skipped in the calculation). The investor then goes long on stocks with the strongest momentum and short on stocks with the weakest momentum. The portfolio is equally weighted and is rebalanced monthly. The investor holds long-short portfolios only during February-December -> January is excluded as this month has been repeatedly documented as a negative month for a momentum strategy (see "January Effect Filter and Momentum in Stocks").
Hedge for stocks during bear markets
Yes – Based on the source research paper (see Table IV), the strategy has a significantly positive return during recession months (as defined by NBER); therefore, it probably can be used as a hedge/diversification to equity market risk factor during bear markets.
Out-of-sample strategy implementation in QuantConnect (chart, statistics & code)
Related picture
Source paper
Nyberg, Poyry: Firm Expansion and Stock Price Momentum
Abstract: We document a significant and robust connection between firm-level asset expansion and stock price momentum. Momentum profits are large and significant within groups of firms that have experienced large asset expansions or contractions, whereas they are small and often insignificant within groups of firms with smaller changes in assets. The interaction between asset growth and momentum is not subsumed by and often dominates previously documented cross-sectional drivers of momentum, and it shows up in various market states where prior literature has documented an absence of momentum profits. Furthermore, we find a positive time-series relation between aggregate firm asset expansion and return momentum. Our results have implications for theories aiming to explain the momentum anomaly.
Other papers
Lu, Stambaugh, Yuan: Anomalies Abroad: Beyond Data Mining
Abstract: A pre-specified set of nine prominent U.S. equity return anomalies produce significant alphas in Canada, France, Germany, Japan, and the U.K. All of the anomalies are consistently significant across these five countries, whose developed stock markets afford the most extensive data. The anomalies remain significant even in a test that assumes their true alphas equal zero in the U.S. Consistent with the view that anomalies reflect mispricing, idiosyncratic volatility exhibits a strong negative relation to return among stocks that the anomalies collectively identify as overpriced, similar to results in the U.S.