
Quantpedia is The Encyclopedia of Quantitative Trading Strategies
We've already analyzed tens of thousands of financial research papers and identified more than 1000 attractive trading systems together with thundreds of related academic papers.
- Unlock Screener & 300+ Advanced Charts
- Browse 1000+ uncommon trading strategy ideas
- Get new strategies on bi-weekly basis
- Explore 2000+ academic research papers
- View 800+ out-of-sample backtests
- Design multi-factor multi-asset portfolios
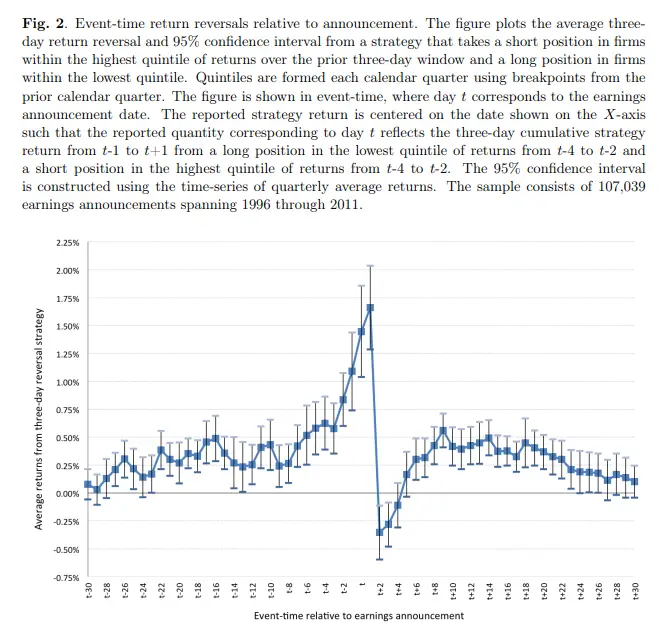
Even though earnings announcements are anticipated events in most cases, multiple academic papers find the evidence that they still affect stock prices and therefore create a potentially profitable trading opportunity. For instance, one of the recent works shows that the short-term reversal is much stronger around the days of earnings announcement than in other, randomly chosen periods. More precisely, the LOW-HIGH (buying past losers and selling past winners) strategy yielded an average 3-day return (the window of t-1, t, and t+1, where t is the day of earnings announcement) of 1.45% during the 1996-2011 sample period. In contrast, the average return during random pseudo-announcement periods was only 0.22% (therefore more than a six-fold difference). The phenomenon, as suggested by the authors, is related to market makers‘ decisions regarding liquidity provision (see fundamental reason). The strategy further described is carried out on the subsample of big stocks due to better liquidity.
Fundamental reason
In general, a reversal in the price of an asset occurs due to investors' overreaction to asset-related news and the subsequent price correction. In this case, the most probable reason for the phenomenon, according to the authors, is the market makers' aversion to inventory risks that tend to increase dramatically in the pre-announcement period. Consequently, the market makers demand higher compensation for providing liquidity due to higher risk and therefore raise prices, which are expected to reverse after the earnings announcement.
Get Premium Strategy Ideas & Pro Reporting
- Unlock Screener & 300+ Advanced Charts
- Browse 1000+ unique strategies
- Get new strategies on bi-weekly basis
- Explore 2000+ academic research papers
- View 800+ out-of-sample backtests
- Design multi-factor multi-asset portfolios
Strategy profile
- Market factors
- Equities
- Financial instruments
- Stocks
- Regions
- United States
- Number of traded instruments
- 1000
more or less, it depends on investor's need for diversification
- Complexity
- Complex
- Rebalancing period
- Daily
- Confidence in anomaly's validity
- Moderate
OOS back-test shows slightly negative performance. It looks, that strategy's alpha is deteriorating in the out-of-sample period.
- Transaction costs
- Mentioned
No trading-cost deduction is applied to reported reversal-strategy returns. The paper discusses bid-ask bounce as a potential source of inflated reversals and uses alternative open-to-close, midpoint-to-midpoint, and one-day-skip return measures to mitigate it (Section 2.2; Table 3), and reports relative bid-ask spreads as a sample characteristic (Table 1), but does not specify commissions, slippage, market impact, borrowing fees, or a transaction-cost amount for the backtest.
- Robustness checks
- Assessed
The primary announcement-window reversal result is tested with open-to-close, midpoint-to-midpoint, and close-to-close returns with a one-day gap; actual-announcement reversals remain over 100 bps and at least five times pseudo-announcement reversals (Table 3). It is also tested using turnover weighting, risk/news controls and pre/post-decimalization regressions (Tables 3–4), size partitions and adverse-selection-resistant weights (Table 5), and alternative inventory-risk proxies/expected announcement timing (Tables 6–7). The reversal remains significant among high-size firms: 158.8 bps over the three-day announcement window in SIZE Q5 (Table 5, Panel A). Authors conclude the finding is not driven by bid-ask bounce, adverse selection, or the baseline return specification.
Source-paper performance
- Backtest period
- 1996 – 2011
- Indicative performance
- 6.5%
per annum, annualized (arithmetically, assuming 10 rebalances per quarter) average 3-day return of high-size stocks (Q5 SIZE quintile), data from table 5
- Estimated volatility
- 3.76%
estimated from t-statistic, data from table 5
- Maximum drawdown
- -65.88%
not stated
- Sharpe ratio
- 1.73
Simple trading strategy
The investment universe consists of stocks listed at NYSE, AMEX, and NASDAQ, whose daily price data are available at the CRSP database. Earnings-announcement dates are collected from Compustat. Firstly, the investor sorts stocks into quintiles based on firm size. Then he further sorts the stocks in the top quintile (the biggest) into quintiles based on their average returns in the 3-day window between t-4 and t-2, where t is the day of the earnings announcement. The investor goes long on the bottom quintile (past losers) and short on the top quintile (past winners) and holds the stocks during the 3-day window between t-1, t, and t+1. Stocks in the portfolios are weighted equally.
Hedge for stocks during bear markets
Unknown – Source and related research papers don't offer insight into the correlation structure of the proposed trading strategy to equity market risk; therefore, we do not know if this strategy can be used as a hedge/diversification during the time of market crisis. The strategy is built as a long-short, but it can be split into two parts. The long leg of the strategy is surely strongly correlated to the equity market; however, the short-only leg might be used as a hedge during bad times. Rigorous backtest is, however, needed to determine return/risk characteristics and correlation.
Out-of-sample strategy implementation in QuantConnect (chart, statistics & code)
Related picture
Source paper
So, Wang: News-Driven Return Reversals: Liquidity Provision Ahead of Earnings Announcements
Abstract: This study documents a six-fold increase in short-term return reversals during earnings announcements relative to non-announcement periods. Following prior research, we use reversals as a proxy for expected returns market makers demand for providing liquidity. Our findings highlight significant time-series variation in the magnitude of short-term return reversals and suggest that market makers demand higher expected returns prior to earnings announcements because of increased inventory risks that stem from holding net positions through the release of anticipated earnings news. Collectively, our findings suggest that uncertainty regarding anticipated information events elicits predictable increases in expected returns to liquidity provision and that these increases significantly affect the dynamics and information content of market prices.
Other papers
Jansen, Nikiforov: Fear and Greed: a Returns-Based Trading Strategy around Earnings Announcements
Abstract: This study documents that earnings announcements serve as a reality check on short-term, fear and greed driven price development: stocks with extreme abnormal returns in the week before an earnings announcement experience strong price reversal around the announcement. A trading strategy that exploits this reversal is profitable in 40 of the last 42 years and earns abnormal returns in excess of 1.3% over a two day-window.