
Quantpedia is The Encyclopedia of Quantitative Trading Strategies
We've already analyzed tens of thousands of financial research papers and identified more than 1000 attractive trading systems together with thundreds of related academic papers.
- Unlock Screener & 300+ Advanced Charts
- Browse 1000+ uncommon trading strategy ideas
- Get new strategies on bi-weekly basis
- Explore 2000+ academic research papers
- View 800+ out-of-sample backtests
- Design multi-factor multi-asset portfolios
The post-earnings announcement drift (the tendency of stocks to drift in the direction of earnings announcement surprise during next quarter) is a well-known effect many times analyzed in academic literature. However, recent research speculates that maybe it is known too much.
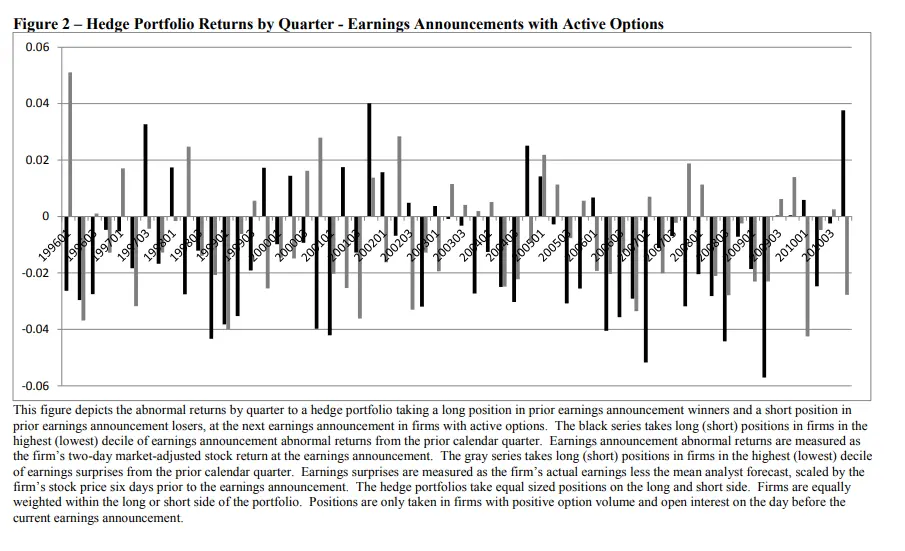
Arbitrageurs started to exploit this anomaly, and it seems that the effect reversed in most liquid stocks. Research paper by Milian shows that stocks which had the worst return during past earning announcement deliver substantially better return during the days around the next earnings announcement. Classical PEAD (post-earnings announcement drift) literature examines mainly quarterly returns; therefore, it is probable that PEAD still holds. However, Milian's work shows a way how to profit from traders' over-reaction to a classical anomaly.
Fundamental reason
The academic paper speculates that it seems that due to their well-documented history of apparently underreacting to earnings news, investors are now overreacting to earnings announcement news. However, classical PEAD (post-earnings announcement drift) literature examines mainly quarterly portfolio returns while this academic paper focuses on 2-days return; therefore, it is probable that PEAD still holds and both anomalies exist concurrently.
Get Premium Strategy Ideas & Pro Reporting
- Unlock Screener & 300+ Advanced Charts
- Browse 1000+ unique strategies
- Get new strategies on bi-weekly basis
- Explore 2000+ academic research papers
- View 800+ out-of-sample backtests
- Design multi-factor multi-asset portfolios
Keywords
Strategy profile
- Market factors
- Equities
- Financial instruments
- Stocks
- Regions
- United States
- Number of traded instruments
- 4
estimated average number of stocks held during one day
- Complexity
- Complex
- Rebalancing period
- Daily
- Confidence in anomaly's validity
- Moderate
OOS back-test shows slightly negative performance. It looks, that strategy's alpha is deteriorating in the out-of-sample period.
- Transaction costs
- Mentioned
Transaction/implementation costs are discussed as potential explanations for PEAD (including bid-ask spreads, short-sale loan fees, and availability of shares to short); the paper notes that put options may avoid short-sale costs (Sections 2.2–2.3, pp. 8–11). However, no numerical transaction-cost, spread, borrowing-fee, slippage, or other cost adjustment is applied to the primary active-options hedge-portfolio returns in Table 4.
- Robustness checks
- Assessed
For the primary active-options PEAD hedge portfolio, Table 4 (p. 39) tests both alternative prior-news signals (LagEARet and LagESurp) and the full sample versus 1996–2003Q2 and 2003Q3–2010 subsamples; High–Low returns remain negative and significant under both signals in each reported period. Table 5 (p. 40) further controls for prior surprises/returns, option variables, pre-announcement returns, size, market-to-book, and accruals; prior earnings news remains significantly negative overall and especially in 2003Q3–2010, while the linear controlled relation is not significant in the first subperiod.
Source-paper performance
- Backtest period
- 1996 – 2010
- Indicative performance
- 40.32%
per annum, annualized (aritmethically) daily return of 0.32%, daily return is estimated as 1/4 of 2-day return 1.29%, data from table 4 panel A, daily return is lowered to 1/4 as it can be expected that portfolio would not be held every day (earnings announcements are distributed sporadically during calendar year)
- Estimated volatility
- Not reported
not stated
- Maximum drawdown
- -93.21%
not stated
- Sharpe ratio
- Not reported
Simple trading strategy
The investment universe consists of all stocks from NYSE, AMEX, and NASDAQ with active options market (so mostly large-cap stocks). Each day investor selects stocks which would have earnings announcement during the next working day. He then checks the abnormal performance of these stocks during the previous earnings announcement. Investor goes long decile of stocks with the lowest abnormal past earnings announcement performance and goes short stocks with the highest abnormal past performance. Stocks are held for two days, and the portfolio is weighted equally.
Hedge for stocks during bear markets
Unknown – Source and related research papers don't offer insight into the correlation structure of the proposed trading strategy to equity market risk; therefore, we do not know if this strategy can be used as a hedge/diversification during the time of market crisis. The strategy is built as a long-short, but it can be split into two parts. The long leg of the strategy is surely strongly correlated to the equity market; however, the short-only leg might be used as a hedge during bad times. Rigorous backtest is, however, needed to determine return/risk characteristics and correlation.
Out-of-sample strategy implementation in QuantConnect (chart, statistics & code)
Related picture
Source paper
Miliian: Overreacting to a History of Underreaction?
Abstract: Prior research has documented a long history of positive autocorrelation in firms’ earnings announcement news. This is one of the main features of the post-earnings announcement drift phenomenon and is typically attributed to investors’ underreaction to earnings news. I document that this autocorrelation has become significantly negative for firms with active exchange-traded options. For these easy-to-arbitrage firms, the firms in the highest decile of prior earnings announcement abnormal return (prior earnings surprise), on average, underperform the firms in the lowest decile by 1.29% (0.73%) at their next earnings announcement. Additional analyses are consistent with investors learning about post-earnings announcement drift and overcompensating. It seems that due to their well-documented history of apparently underreacting to earnings news, investors are now overreacting to earnings announcement news. This paper shows that attempts to exploit a popular trading strategy based on relative valuation can significantly reverse the previously documented pattern.