It Is Hard to Profit by Buying Options and Betting on Higher Volatility

A new financial research paper has been published and is related to:

#20 – Volatility Risk Premium Effect

Authors: Israelov, Tummala

Title: Being Right is Not Enough: Buying Options to Bet on Higher Realized Volatility

Link: https://papers.ssrn.com/sol3/papers.cfm?abstract_id=3248500

Abstract:

Speculators who wish to bet on higher future volatility often purchase options to “go long volatility.” Should investors who buy options expect to profit when realized volatility increases? If so, under what conditions? To answer these questions, we conduct an analysis of the relationship between long volatility performance (buying options) and contemporaneous changes in volatility. We find that buying one-month S&P 500 options is only consistently profitable in the highest decile of changes in one-month volatility. Buying options consistently loses money in the lowest seven deciles of changes in volatility. We then study the trade entry and exit timing required to retain the profits from long option positions during significant volatility increases. We find similar results in global equity option markets.

Notable quotations from the academic research paper:

"During most of the mid-2010s, the S&P 500 Index’s volatility hovered near its historical lows. This calm environment has led many investors to ask whether low volatility presents an opportunity to obtain “cheap” portfolio downside protection by purchasing index options. Israelov and Nielsen (2015) show that the answer to this question is no. They show that the Volatility Risk Premium (VRP) also exists in low volatility environments, and therefore that portfolio protection is still expensive even in calm markets.

Portfolio protection, however, is not the only rationale for purchasing options. A long option position allows a speculator to bet on rising volatility. Many proponents of long volatility exposure often advocate this trade in a low implied volatility market environment. Heightened levels of uncertainty, geopolitical risk, or merely a reversion to long-term volatility are some of the arguments put forth by those who expect volatility to spike.

A recommendation to buy options to capture a predicted increase in volatility is predicated on the assumption that investors profit from long options (or long volatility) positions when volatility increases. This paper tests that assumption.

Although it may seem unintuitive, we show that long volatility positions can lose money even when realized volatility rises. How can this be true? Because, long volatility investors must overcome the well-documented VRP – the difference between implied and realized volatility – just to break even. On average this VRP spread is around 3% in the S&P 500. Therefore, the VRP spread typically accrues to the volatility seller, paid by the long volatility investor. As such, long volatility investors enter their trade facing a significant head wind.
volatility risk premium

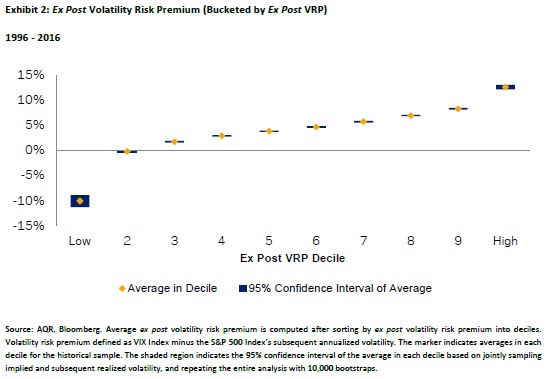
Exhibit 2 sorts the ex post VRP into deciles and reports the average within each decile. On average, equity index options have been richly priced, with an average VRP of 3.0%. The VRP was positive around 85% of the time. Correspondingly, Exhibit 2 shows that, on average, the VRP is positive in eight of the ten deciles, approximately flat in one decile, and negative in one decile. This result implies that long volatility positions in one-month equity index options have been profitable infrequently.
long options returns

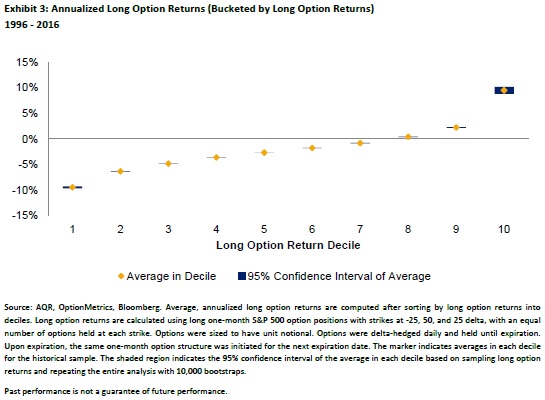
Exhibit 3 sorts the returns of the long option portfolios into deciles, and reports their average annualized return within each decile. Similar to Exhibit 2, Exhibit 3 shows that long option portfolios were infrequently profitable (28% of the time). Average returns were negative in seven of the ten deciles, flat in one decile, and profitable in two. Sorting on actual profitability reveals that there are relatively few profit opportunities.

Volatility mean-reverts over the long run. With equity volatility at historical lows in the mid-2010s, many market commentators suggested long volatility positions in order to bet on increases in volatility. But are bets on increasing volatility actually profitable when volatility increases?
performance table

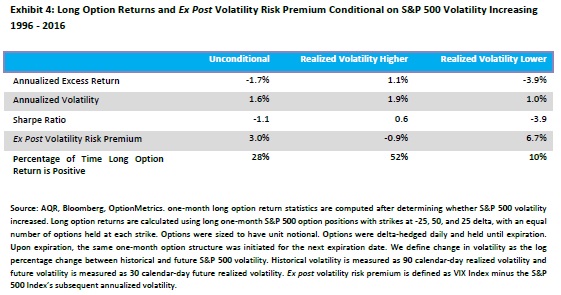
Using our change in volatility measure, we document that over 30-day periods volatility increased 43% of the time in the S&P 500 between 1996 and 2016. Exhibit 4 reports the long option portfolio’s return properties conditional on only holding options during those 30-day periods in which volatility actually increased. For a more complete picture, the exhibit also reports return properties of the unconditional long option portfolio in which the investor does not attempt to time, as well as return properties conditional on periods in which volatility decreased. Having perfect foresight into whether equity markets become more volatile is profitable, but not reliably so. The conditional ex post VRP is -0.9% during periods in which volatility increased versus the 3.0% unconditional VRP. During periods when volatility increased, the average conditional delta-hedged long option annualized return is 1.1%, with a 0.6 Sharpe ratio. This is certainly better than the unconditional long option annualized return of -1.7%, with a -1.1 Sharpe ratio, and considerably better than the conditional long option annualized return of -3.9% and corresponding -3.9 Sharpe ratio during periods when volatility decreased. However, even when realized volatility increases, long option returns are only profitable about half the time. A small set of out-sized volatility increases is what led to positive conditional average long option returns. This suggests that even knowing with certainty that volatility will increase is not enough to reliably profit from a long volatility position. The investor is left with a coin flip in terms of the hit rate of holding a long option position in this scenario.
performance table

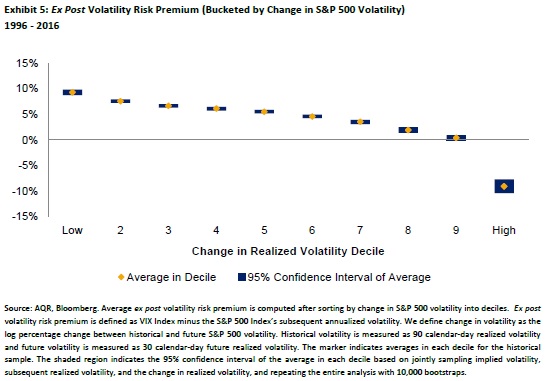
Then what condition is sufficient to reliably profit? We sort the ex post VRP into deciles by change in volatility and report the average in each decile in Exhibit 5. The ex post VRP is only negative in the tenth decile. It is also interesting that the first decile’s average VRP is more positive than the tenth decile’s is negative.
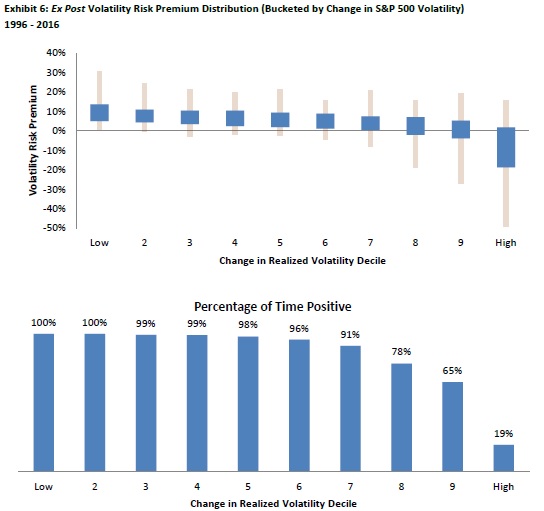
distribution

Exhibit 6 shows the distribution of the ex post VRP within each decile. The ex post VRP was positive more than 90% of the time in seven of the ten deciles, and positive more than 65% of the time in the eighth and ninth decile. The only decile in which the ex post VRP was consistently negative was the tenth decile. Correspondingly, large increases in volatility are the only time that we expect long option positions to be profitable.
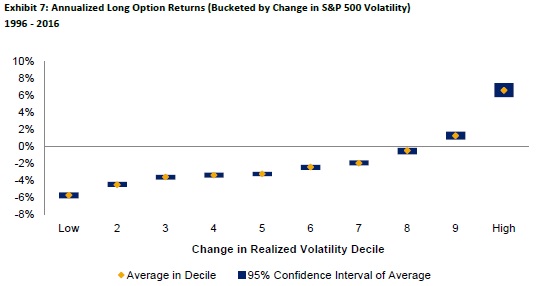
annualizaed option returns

Realized option returns are likely more interesting to option investors than the difference between implied and realized volatility. In that regard, we next sort long option returns into deciles by change in volatility, and report the average annualized return in each decile in Exhibit 7.
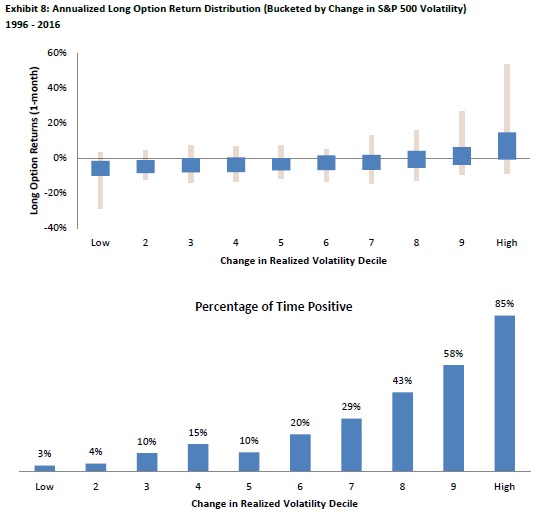
annualizaed option returns distribution

Average long option returns were negative in eight of the ten deciles. Exhibit 8 shows the distribution of long option returns in each decile. Long option returns were consistently negative in most deciles, positive slightly more than half the time in the ninth decile, and consistently positive (85% of the time) in the tenth decile.

Overall, the results for long option returns are similar to those found for the ex post VRP. To consistently profit from a long volatility position on the basis of forecasting changes in volatility, you would have had to predict a 10% probability outcome. The average, annualized long option return in this decile was 6.6% and the average return across the other nine deciles was -2.7%.

Due to these considerations, tactical long volatility traders face a steep uphill battle. Managers who are able to successfully implement this strategy should be given credit for demonstrating exceptional skill (or congratulated for their good luck). However, some amount of healthy skepticism is likely warranted for those who claim to consistently have such exceptional skill."


Are you looking for more strategies to read about? Check http://quantpedia.com/Screener

Do you want to see performance of trading systems we described? Check http://quantpedia.com/Chart/Performance

Do you want to know more about us? Check http://quantpedia.com/Home/About


Follow us on:

Facebook: https://www.facebook.com/quantpedia/

Twitter: https://twitter.com/quantpedia

Continue reading »

VVIX Index Predicts Value/Growth Return Spread

A new financial research paper has been published and is related value/growth style returns:

#26 – Value (Book-to-Market) Anomaly

Author: Krause

Title: Risk and Uncertainty in Style Rotation

Link: https://papers.ssrn.com/sol3/papers.cfm?abstract_id=3209491

Abstract:

The effectiveness of the VIX index as a leading indicator of style returns has been examined in the finance literature, finding that increases in this “fear index” lead to outperformance of “value” vs “growth” stocks, although the effect has attenuated over time. This study introduces the concept of “uncertainty” as an additional indicator of returns to value, as measured by the CBOE® VVIX (“volatility of volatility”), that that may be considered as a proxy for “uncertainty” in the Knightian sense. Increases in uncertainty (the VVIX index) lead to negative short-term returns to value. Additional macroeconomic variables provide additional incremental information regarding these phenomena.

Notable quotations from the academic research paper:

"this study examines the effectiveness of the two CBOE® volatility indices as leading indicators of style returns (value vs. growth), and the results of the analysis indicate that the CBOE® VVIX index provides significant incremental information regarding the interaction of returns, volatility, and uncertainty on a lead-lag basis. The initial analysis of the VIX index relative to style returns is consistent with Boscaljon et al. (2011) since it finds largely insignificant short-term effects of the VIX index on returns to value.

However, innovations in the VVIX index indicate significant negative returns to value. The inclusion of several macroeconomic variables provides additional explanatory information since the VIX index indicates positive returns to value under certain conditions. The main contribution to the literature of this paper is the introduction of the additional concept of “uncertainty” into the returns to value analysis using highly liquid ETFs. The availability of these products, and their recent exponential growth, provides an opportunity to examine the relation of expected volatility and uncertainty to growth and value using similar, easily tradable and low-cost instruments.

In order to further explore the returns to value from uncertainty as proxied by the VVIX index, in Table 5, changes in the VVIX index are included in the estimations of Equation 2 as a potentially further explanatory, independent variable. In this estimation, there is one indication of the potential returns to value from volatility in conjunction with uncertainty. In Panel A, for the large-cap ETFs, the results for five-day returns to value are significantly positive for changes in the VIX index (volatility) at the five percent level, although some other coefficients (10- and 20- day) are significant at the ten percent level. Additionally, the coefficients are significant and negative for changes in the VVIX index (uncertainty) over five- to thirty-day time periods (the 20-day coefficient is marginally significant) at the five percent level.

VVIX vs value/growth stocks

"


Are you looking for more strategies to read about? Check http://quantpedia.com/Screener

Do you want to see performance of trading systems we described? Check http://quantpedia.com/Chart/Performance

Do you want to know more about us? Check http://quantpedia.com/Home/About


Follow us on:

Facebook: https://www.facebook.com/quantpedia/

Twitter: https://twitter.com/quantpedia
Continue reading »

Bitcoin Returns Resemble Returns of High Sentiment Beta Stocks

A new financial research paper has been published and is related to cryptocurrency trading strategies:

Author: Jo, Park, Shefrin

Title: Bitcoin and Sentiment

Link: https://papers.ssrn.com/sol3/papers.cfm?abstract_id=3230572

Abstract:

On the surface, cryptocurrencies share important features in common with high sentiment beta stocks. Baker and Wurgler (2007) identify high sentiment betas with small startup firms that have great growth potential. This paper investigates the degree to which, during the period July 18, 2010 to February 26, 2018, the return to bitcoin displayed the characteristics of a high sentiment beta stock. Using a sentiment-dependent factor model, the analysis indicates that in large measure, bitcoin returns resembled returns to high sentiment beta stocks.

Notable quotations from the academic research paper:

"The main objective of this paper is to investigate the degree to which bitcoin resembles a “high sentiment beta” stock, a term introduced by Baker and Wurgler (2007). They note that some stocks are more vulnerable to being mispriced than others, stating: “stocks of low capitalization, younger, unprofitable, high-volatility, non–dividend paying, growth companies … are likely to be disproportionately sensitive to broad waves of investor sentiment.” This statement implies that when investors become excessively optimistic about stocks in general, they become even more optimistic about stocks of small firms that, while not currently profitable, are perceived as holding great potential for future profitability. Baker and Wurgler describe stocks that are disproportionately sensitive to investor sentiment as featuring “high sentiment beta.”

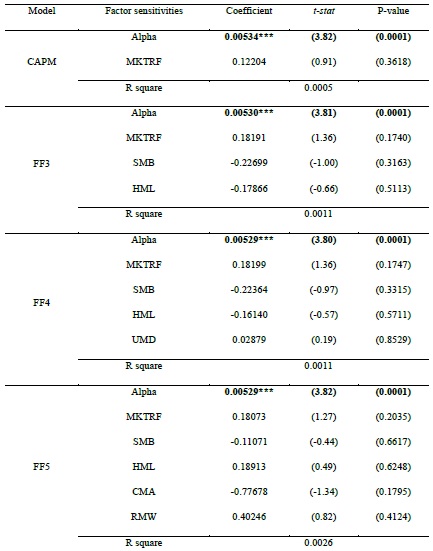
bitcoin's alpha

Table 3 presents the coefficient estimates of CAPM, Fama-French three, Carhart four, and Fama-French five factor models for U.S. daily excess returns on excess Bitcoin Return. We note that Jensen’s alpha is significant and positive at the 0.1% significance level in all the above asset pricing models during our sample period. Notice too that all of the coefficients of CAPM and Fama-French market and other factors are insignificant, suggesting that bitcoin returns are largely nonsystematic, at least from the perspective of a traditional factor pricing model.

There are at least three different channels by which sentiment can impact bitcoin returns. The first channel is bitcoin-specific, which is reflected in bitcoin’s Jensen’s alpha. The second channel involves the sensitivity of bitcoin’s price to general market sentiment. Baker and Wurgler (2007) describe such sentiment as general optimism about stocks.

The third channel involves the manner in which sentiment mediates fundamental factor loadings, as noted by Baker and Wurgler (2006). Of special interest is the impact of sentiment on factor loadings associated with size (SMB) and profitability (RMW), because of the analogy between bitcoin and Baker and Wurgler’s association of high sentiment beta to small startup firms that are not yet profitable but possess great growth potential. Because bitcoin is the cryptocurrency most closely associated with a blockchain technology, and blockchain activity is positively related to general economic activity, our prior expectation is that bitcoin returns will be statistically related to the market risk premium.

factor loadings

The results displayed in Table 5 Panel A indicate the following. First, the returns to bitcoin are statistically related to the market risk premium. Moreover, the interaction term involving the market risk premium features a negative coefficient. Therefore, when sentiment declines, bitcoin returns become more sensitive to the market risk premium.

Factor loading estimates for two other interaction terms are statistically significant. The first pertains to size (SMB), with a negative sign, and the second pertains to investment (CMA), with a positive sign. The bitcoin size effect is that when sentiment declines, bitcoin returns share a common feature with the stocks of small firms. This finding has the same flavor as Baker and Wurgler’s finding that the size effect only applies in connection with periods of negative sentiment. In particular, this finding is in line with the intuitive association of new cryptocurrencies to the stocks of small startups. The bitcoin investment effect is that when sentiment declines, bitcoin returns share a commonality with firms that invest aggressively rather than conservatively. In this respect, aggressive investment reduces firms’ free cash flows and equity returns, whose effect on bitcoin is most pronounced during times in which investors generally become more bearish.

Table 5 Panel A indicates that bitcoin returns are statistically related to the coefficient on the Fama-French profitability factor RMW ( 5 ), and with a positive sign. Therefore, the return to holding bitcoin is generally positive during periods when the stocks of higher profitability firms outperform the stocks of lower profitability firms. At first glance, this finding appears to be at odds with bitcoin returns resembling the returns to the stocks of unprofitable firms. However, in interpreting this finding, it is important to keep in mind that the return to small growth stocks cannot be explained by the Fama-French three-factor model, as those stocks have historically earned low returns, not the high returns predicted by the model. Similarly, in the extended Fama-French factor model, profitability is related differently to small, growth stocks than to other stocks.

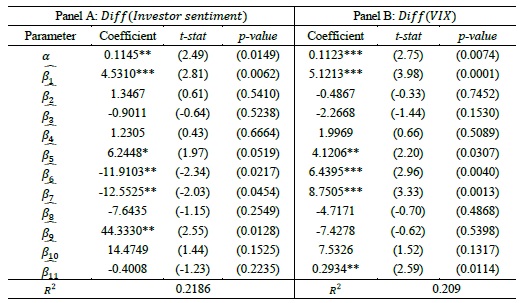
One of the main implications of the regression analysis above is that sentiment impacts bitcoin returns indirectly through traditional factors, but with no direct discernable direct effect. This leaves open the question of how bitcoin returns and sentiment have coevolved over time. To investigate this issue, we employ Vector Auto Regression (VAR) models that focus on the dynamic relationship between Investor sentiment index and Bitcoin Return.

VAR model

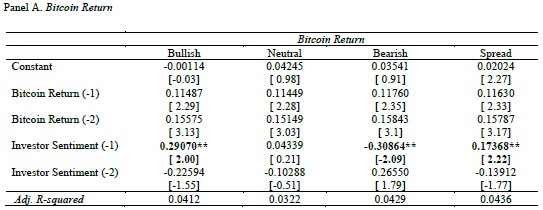
The results suggest that while Bitcoin Returns do not Granger-cause Investor Sentiment Index for the Investor Sentiment equations (Panel B), Investor Sentiment Index does Granger-cause Bitcoin Returns for the ratio of the Bitcoin Returns equation (Panel A). In particular, bullish (bearish) investor sentiment significantly drives Bitcoin Returns positively (negatively). It is noteworthy that although the time period of the bitcoin price decrease (i.e., January-February, 2018) is much shorter, and the percentage of bearish investor sentiment is somewhat lower, the negative impact of bearish investor sentiment on Bitcoin Returns seems to be a bit larger than the positive impact of bullish investor sentiment on Bitcoin Returns.

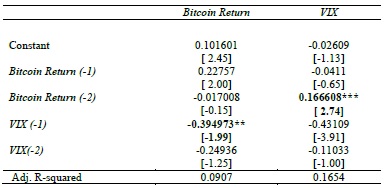
We further conduct VAR analysis with alternative measure of investor sentiment, Volatility Index (VIX) for robustness, and present the results in Table 9.

sensitivity to vix

In Bitcoin Return equation, the coefficient on VIX (lagged 1) is significantly negative, which implies that a change in VIX index from day t–30 to day t negatively affects bitcoin return. This negative impact of VIX on Bitcoin Returns can be interpreted to mean that investors’ fear about the future market tends to induce a decrease in the price of bitcoin. Intuitively, when the volatility index increases, investors grow afraid of increased volatility, and sell bitcoin, lowering the bitcoin price. Expressed differently, if the VIX decreases, then the market is less volatile, and investors become willing to take risks to earn above average returns by buying bitcoin, thereby driving up its price."


Are you looking for more strategies to read about? Check http://quantpedia.com/Screener

Do you want to see performance of trading systems we described? Check http://quantpedia.com/Chart/Performance

Do you want to know more about us? Check http://quantpedia.com/Home/About


Follow us on:

Facebook: https://www.facebook.com/quantpedia/

Twitter: https://twitter.com/quantpedia
Continue reading »

Beta Herding and Low-Beta Anomaly

A new financial research paper has been published and is related to:

#77 – Beta Factor in Stocks

Author: Hwang, Rubesam, Salmon

Title: Overconfidence, Sentiment and Beta Herding: A Behavioral Explanation of the Low-Beta Anomaly

Link: https://papers.ssrn.com/sol3/papers.cfm?abstract_id=3224321

Abstract:

We investigate asset returns using the concept of beta herding, which measures cross-sectional variations in betas induced by investors whose beliefs about the market are biased due to changes in confidence or sentiment. Overconfidence or optimistic sentiment causes beta herding (compression of individual assets’ betas towards the market beta), while under-confidence or pessimistic sentiment leads to adverse beta herding (dispersion of betas away from the market beta). We find that beta herding is related to the low-beta anomaly, as high beta stocks underperform low beta stocks on a risk-adjusted basis exclusively following periods of adverse beta herding. As an explanation of the low-beta anomaly, we propose the persistence of bias in betas (i.e., a large difference in betas) that lasts for more than one year as market uncertainty continues.

Notable quotations from the academic research paper:

"In this study we fill the gap in the literature by investigating the bias in cross-sectional asset returns when individual asset prices move together regardless of their fundamentals. We propose a mechanism that explains this comovement in asset returns with respect to two well-known behavioral biases in finance: investor overconfidence and sentiment.

We demonstrate that the cross-sectional difference in the expected returns and betas of individual assets is suppressed when investors are overconfident about signals of the market outlook, and thus their posterior prediction of the market return is overly affected by these signals. A comparable compression of betas arises in the presence of investor sentiment. When optimistic views about the market outlook prevails, individual betas are biased towards the market beta. The opposite case is also possible: when investors are under-confident about the market outlook or their sentiment is pessimistic, the difference between individual betas increases.

This type of cross-sectional bias in betas is referred to as “beta herding” in this study because individual betas are biased (herd) towards the market beta regardless of their equilibrium risk-return relationship, when investors’ market outlook is excessively affected by their optimism or overconfidence about the market outlook. In practice, when beta herding arises, investors may buy assets whose returns increase less than the market because these assets would appear relatively cheap. Likewise, they may sell assets whose returns increase more than the market because these assets would seem to be relatively expensive and the opportunity for taking apparent profits might be hard to resist. In fact, the more confident or optimistic investors are about their market outlook, the more likely they are to trade at a price close to their view.

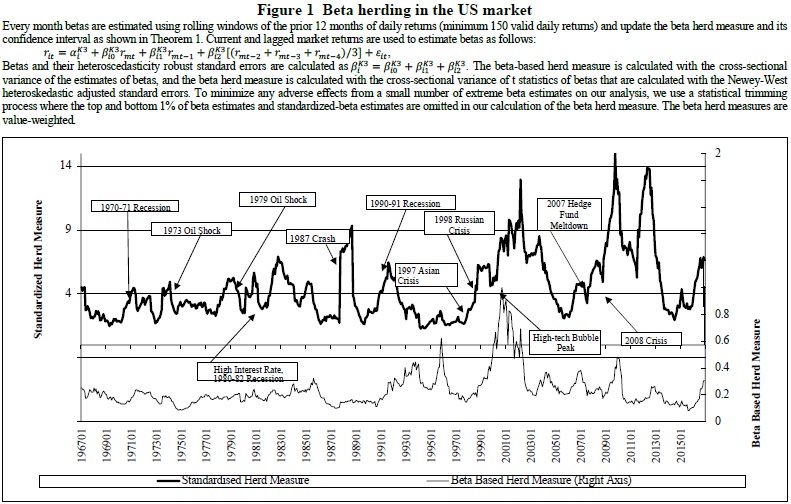
In our model, high and low beta stocks are not affected differently by beta herding, and thus beta herding can be easily measured by the cross-sectional variance of standardized-betas, which are equivalent to the t-statistics of beta estimates. The standardized-beta provides information on the precision of the beta estimate in addition to its magnitude, and more importantly, makes it possible to compare the dynamics of beta herding over different periods.

Beta herding

We find that the low-beta anomaly is observed only after periods of adverse beta herding, when the dispersion of standardized-betas increases: for value-weighted decile portfolios formed on standardized-betas, the risk-adjusted return of the high-minus-low portfolio over the 12 months following adverse beta herding is -11.4% per year, whereas the returns are not different from zero following periods of no beta herding or high beta herding. The effects of adverse beta herding on standardized-beta sorted portfolios are quite persistent and remain significant over two years."


Are you looking for more strategies to read about? Check http://quantpedia.com/Screener

Do you want to see performance of trading systems we described? Check http://quantpedia.com/Chart/Performance

Do you want to know more about us? Check http://quantpedia.com/Home/About


Follow us on:

Facebook: https://www.facebook.com/quantpedia/

Twitter: https://twitter.com/quantpedia
Continue reading »

Equity Factors in Emerging Markets

A new financial research paper has been published and is related to multiple equity factor strategies:

Author: Atilgan, Demirtas, Gunaydin

Title: The Cross-Section of Equity Returns in Emerging Markets

Link: https://papers.ssrn.com/sol3/papers.cfm?abstract_id=3225034

Abstract:

This study investigates the relation between a comprehensive set of firm-specific attributes and future equity returns for a sample of stocks from 27 emerging markets. Univariate analyses based on equal-weighted portfolio returns reveal that the low beta, firm size, book-to-market ratio, momentum and illiquidity anomalies are also observed in emerging markets whereas short-term reversal, left-tail risk and lottery demand effects manifest themselves in the opposite direction compared to U.S. studies. Value-weighted portfolio returns and bivariate analyses that control for firm size show that some of these results are driven by small stocks. After we control for all attributes simultaneously in a regression framework, we find that the most robust cross-sectional effects for emerging market equities are medium and short-term return momentum.

Notable quotations from the academic research paper:

"Although there is no shortage of research on the cross-section of equity returns in emerging markets, these studies are restricted in the sense that they only focus on a limited number of potential determinants of expected returns and/or they only conduct their analyses in a single country or a small group of countries. Our contribution is that we compile a large set of firm-specific attributes that can potentially impact equity returns and use a comprehensive sample of stocks from 27 emerging markets. Thus, we are able to investigate the independent information that a particular firm-specific attribute provides compared to other attributes and observe the generalizability of our results across all emerging markets. We should also note that we undertake a more modest task in this study by focusing on the potential return determinants that can be extracted from the empirical return distribution of individual equity returns. The U.S. literature also suggests various accounting-based variables as cross-sectional return determinants, however, accounting information is sparse for emerging markets and not easily comparable across countries in a large sample due to differences in accounting practices. The only exception we make is for book-to-market ratio of equity since this variable is included in all contemporary asset pricing models and book value of equity is relatively more available compared to other accounting variables for emerging markets.

To investigate the relation between each firm-specific attribute and expected stock returns, we conduct discrete univariate portfolio analyses by sorting stocks into deciles based on one firm-specific characteristic at a time. Next, we compare the one-month ahead returns of the portfolio that includes equities with the highest values of a firm-specific attribute and the portfolio that includes equities with the lowest values of a firm-specific attribute. For example, if the firm-specific characteristic under focus is market beta, Portfolio 10 contains the stocks with the highest sensitivity towards market movements and Portfolio 1 contains the stocks with the lowest sensitivity towards market movements. The decile portfolios are formed every month starting from January 1989 to December 2014. The main portfolio analysis used in this study combines all equities in the sample, therefore, stocks in each decile come from a multitude of countries.

Firm size is an important mediating variable in cross-sectional studies of equity returns. Many anomalies are driven by smaller stocks implying that some significant relations between firm characteristics and expected returns that manifest themselves in the full sample of equities may not be observed when one focuses solely on large stocks. We employ conditional (dependent) double sorts on firm size and various firm-specific attributes by grouping equities into deciles based on firm size and then into additional deciles based on a certain firm-specific attribute within each size decile. For each firm-specific attribute, this bivariate analysis provides 100 conditionally double-sorted portfolios. Portfolio 1 represents the combined portfolio of stocks with the lowest values of a firm-specific attribute in each size decile and Portfolio 10 represents the combined portfolio of stocks with the highest values of a firm-specific attribute in each size decile. We investigate whether the mean return or alpha differences between two extreme firm-specific attribute deciles is significantly different from zero. This type of analysis can also reveal whether the existence or non-existence of a relation between a certain attribute and expected returns is driven or masked by a significant correlation between the attribute and firm size.

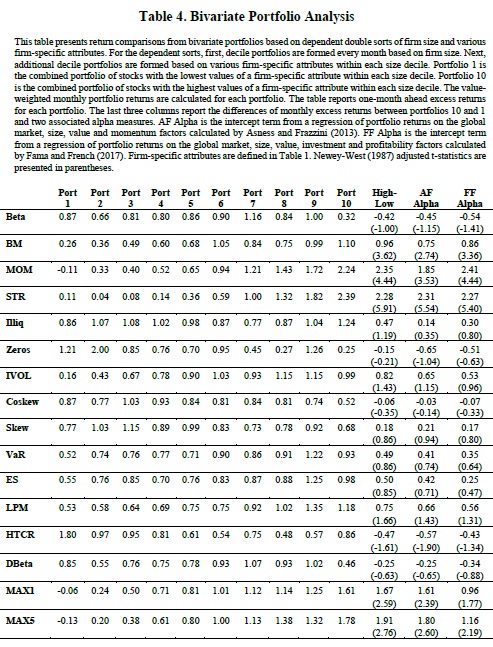
Bivariate portfolio analysis

We find that the return pattern across the market beta deciles is relatively flat, however, the decile returns drop from 1.00% to 0.32% between Portfolio 9 and 10. Despite this sharp drop, the return and alphas to the zero-cost portfolio constructed based on market beta are insignificant. The book-to-market and momentum anomalies survive after controlling for firm size using bivariate sorts. The return and alphas to the zero-cost strategy based on BM are between 75 and 96 basis points with t-statistics of between 2.74 and 3.62. The zero-cost strategy based on momentum reveals even higher returns and alphas with values between 1.85% and 2.41% and t-statistics between 3.53 and 4.44. The short-term reversal strategy still translates as short-term momentum to the emerging market setting. The return difference between the extreme one-month-lagged return deciles is 2.28% with a t-statistic of 5.91 and significantly positive alphas.

The conflicting evidence regarding the illiquidity premium that was uncovered in the univariate analyses is absent when firm size is kept stable across the Amihud’s illiquidity ratio and Zeros deciles. None of the return or alpha measures based on these two metrics are statistically different than zero. We also had found no robust relation between attributes such as idiosyncratic volatility, co-skewness and skewness earlier and these results translate to the bivariate setting as well.

For the three stock-specific left-tail risk measures, we find that the return and alpha metrics for the zero-cost strategy are all positive but statistically insignificant with t-statistics between 0.47 and 1.66. For hybrid tail risk, we observe a generally decreasing pattern of returns across the deciles although the return increases from 57 to 86 basis points from Portfolio 9 to 10. Despite this increase, the returns and alphas to the zero-cost strategy are all negative and statistically insignificant except for AF alpha. Again, there is no relation between downside beta and expected equity returns. Finally, we observe that lottery-like stocks continue to demand higher one-month-ahead returns after the dependent sorts. The return and alpha measures for the zero-cost strategy based on MAX1 and MAX5 vary between 0.96% and 1.91% with t-statistics between 1.77 and 2.76.

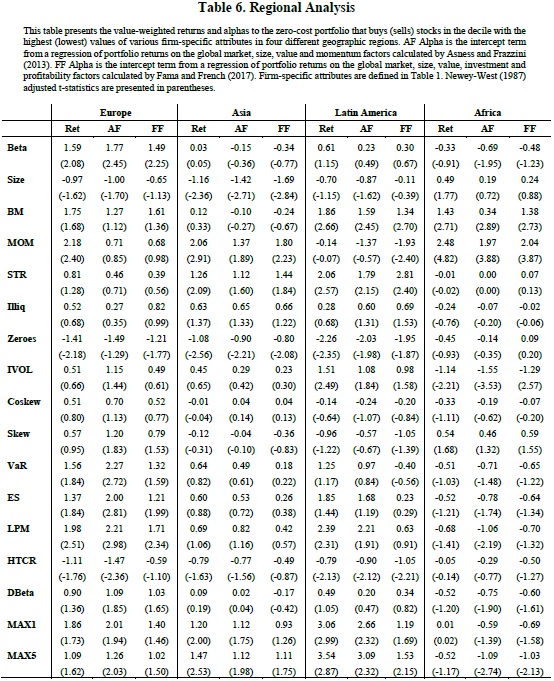
Regional differences

We observed that the firm size, book-to-market and momentum anomalies presented themselves significantly in the overall sample of emerging market equities. By looking at each region separately, we see that these significant relations generally do not show up uniformly in each region and the results encountered in the overall sample are driven by specific regions. For example, although the zero-cost portfolio formed by sorting stocks based on their market value of equity generates a significant return of -1.16% per month with a tstatistic of -2.36 in Asia, no such pattern exists for the other regions. The book-to-market effect seems to be driven by equities in the Latin America and Africa regions. The momentum effect is robust across Europe, Asia and Africa with statistically significant monthly zero-cost portfolio returns of 2.18%, 2.06% and 2.48%, respectively. Table 3 also revealed that the shortterm reversal and lottery demand anomalies produced returns with opposite signs to those expected from U.S. studies in the overall sample. We find that both results are driven mostly by Asian and Latin American countries. The zero-cost portfolio strategy based on STR produces returns of 1.26% and 2.06% with t-statistics of 2.09 and 2.57 in Asia and Latin America, respectively. The zero-cost portfolio strategy based on MAX1 produces returns of 1.20% and 3.06% with t-statistics of 2.00 and 2.99 in Asia and Latin America, respectively.

Although we did not find significant relations between the other firm-specific attributes and future equity returns in our overall emerging market sample, it is possible to observe some predictive power associated with these attributes when we focus on individual regions. First, we find a significantly positive relation between market beta and one-month-ahead equity returns in Europe with a return of 1.59% (t-statistic = 2.08) to the zero-cost portfolio and significant alphas. Second, we find that the illiquidity measure based on non-trading days has a significantly negative relation with one-month-ahead returns in all regions except Africa and IVOL has a significantly positive relation with one-month-ahead returns in Latin America. Third, zero-cost portfolio strategies based on all three stock-specific left-tail risk measures produce significantly positive returns and alphas between 1.21% and 2.27% in Europe. A similar relation is observed in Latin America when LPM is used as the stock-specific left-tail risk measure. Finally, we find that hybrid tail risk is negatively priced in Europe and Latin America.

These results speak to the importance of accounting for regional differences in the patterns pertaining to the cross-section of equity returns."


Are you looking for more strategies to read about? Check http://quantpedia.com/Screener

Do you want to see performance of trading systems we described? Check http://quantpedia.com/Chart/Performance

Do you want to know more about us? Check http://quantpedia.com/Home/About


Follow us on:

Facebook: https://www.facebook.com/quantpedia/

Twitter: https://twitter.com/quantpedia
Continue reading »

Enhanced Factor Portfolios

Authors: Blitz, Vidojevic

Title: The Characteristics of Factor Investing

Link: https://papers.ssrn.com/sol3/papers.cfm?abstract_id=3206798

Abstract:

We dissect the performance of factor-based equity portfolios using a characteristics-based multi-factor expected return model. We show that generic single-factor portfolios, which invest in stocks with high scores on one particular factor, are sub-optimal, because they ignore the possibility that these stocks may be unattractive from the perspective of other factors. We also show that differences in performance between (i) integrated and mixed-sleeve multi-factor portfolios, (ii) small-cap and large-cap factor portfolios, and (iii) equal and value-weighted factor portfolios can be fully attributed to the differences in their factor characteristics. We conclude that efficient factor investing requires a recognition and understanding of how factor characteristics drive portfolio returns.

Notable quotations from the academic research paper:

"We show that generic single-factor portfolios, which are strategies that invest in stocks which score highly on one particular factor are generally sub-optimal, because they ignore the possibility that these stocks may be unattractive from the perspective of other factors. The negative contributions from other factors cause these strategies to have a substantial weight in stocks with negative expected and ex-post realized market-relative returns. We also show that some stocks have such poor factor characteristics that their expected returns end up being lower than returns on Treasuries. By simply removing those stocks from the market portfolio ex-ante, the realized market return increases by 16%, in relative terms, over the sample period that spans more than five decades.

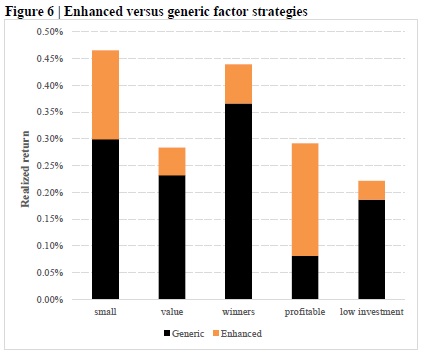
We examine what happens to performance if, each month, we simply remove stocks that have a negative predicted market-relative return from generic factor portfolios. The performance of such enhanced factor strategies is shown in Figure 6. Compared to the generic factor strategies from which they are derived, the performance improvements are about 20% for the value, momentum and investment strategies and about 50% for the small-cap strategy. For the profitability strategy, performance more than triples, from 0.08% to 0.29% per month. This large improvement is not surprising, because a much bigger adjustment is made to this portfolio than to the other factor portfolios. These results imply that generic factor strategies are sub-optimal, and that, even when targeting one particular factor premium, investors should not ignore other established factor premiums.

enhanced premiums

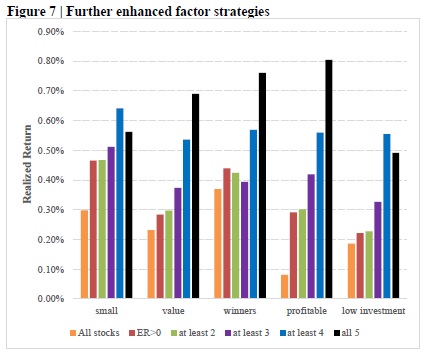
Excluding stocks with expected underperformance helps to enhance a single-factor strategy, but the resulting portfolios can still have stocks with negative exposures to other factors that detract from their performance. We next examine how performance changes if in addition to removing stocks with expected underperformance, we also require stocks to have a non-negative exposure (z-score) to at least one, two, three or four other, non-targeted premiums. Figure 7 shows that realized, full-sample returns of each single factor strategy tend to increase as we require stocks in the portfolios to have non-negative exposures to more factors. For instance, our raw value strategy has a return of 0.23% a month, which increases to 0.28% per month if we ex-ante exclude stocks with negative expected excess returns. If in addition, at the time of portfolio formation, we require that stocks have non-negative exposures to at least two, three, four, and all five factor premiums, the strategy returns increase to 0.30%, 0.37%, 0.54%, and 0.69%, respectively. The number of stocks in the portfolio decreases as we impose more constraints from, on average, 302 with no constraints to 276, 273, 223, 96, and only 13. A similar pattern is observed for other factors, albeit not always monotonic.

enhanced factor premiums 2

Our model is also able to attribute performance differences between integrated and mixed-sleeve multi-factor portfolios to differences in their factor characteristics, and thus resolve the heated discussion in the literature over which approach is better for construction of portfolios with exposures to multiple factors. We further show that return differences between factor portfolios in the small-cap and the large-cap space, and between equally-weighted and value-weighted factor portfolios can also be explained by our model."


Are you looking for more strategies to read about? Check http://quantpedia.com/Screener

Do you want to see performance of trading systems we described? Check http://quantpedia.com/Chart/Performance

Do you want to know more about us? Check http://quantpedia.com/Home/About


Follow us on:

Facebook: https://www.facebook.com/quantpedia/

Twitter: https://twitter.com/quantpedia
Continue reading »