What Works (and Doesn’t Work) in Cryptocurrencies

Authors: Yang

Title: Behavioral Anomalies in Cryptocurrency Markets

Link: https://papers.ssrn.com/sol3/papers.cfm?abstract_id=3174421

Abstract:

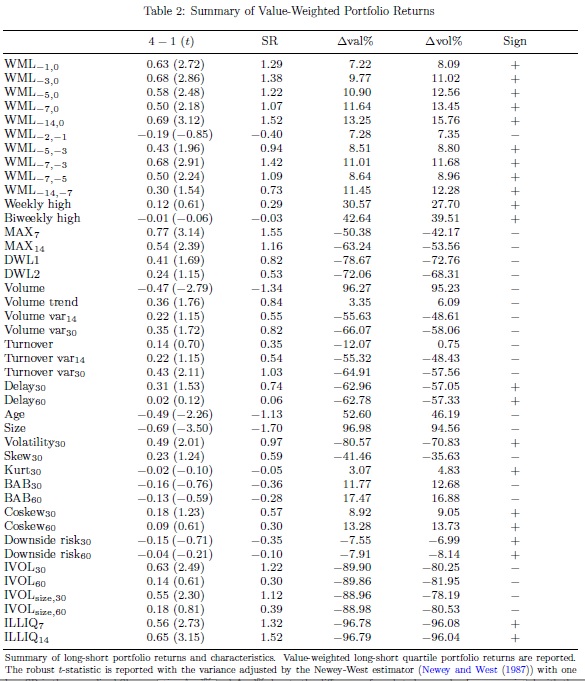
If behavioral biases explain asset pricing anomalies, they should also materialize in cryptocurrency markets. I test more than 20 stock return anomalies based on daily cryptocurrency data, and document strong evidence of price momentum. Unlike stock markets, price reversal and risk-based anomalies are weak, controlling for market and size. Cryptocurrency anomalies can be explained by behavioral theories that place more emphasis on the role of speculators than fundamental traders.

Notable quotations from the academic research paper:

"The speculative and hard-to-value nature makes the cryptocurrency market a novel environment that facilitates the study of behavioral impacts on asset prices. Because speculators account for the vast majority of cryptocurrency market participants, the behavioral impact can be stronger than traditional markets. Aside from this, cryptocurrency markets enjoy some good properties: the overall level of investor sophistication in cryptocurrency markets are much lower; there are only a few institutional investors until recently. Thus, mispricing can be severe. Above stylized facts of cryptocurrency markets fit well into many behavioral theories that particularly emphasize investor irrationality. Thus, if asset pricing anomalies can be explained by behavioral theories, they shall also be reflected in cryptocurrency markets.

Having this in mind, I test more than 20 stock price anomalies based on cryptocurrency data.

List of anomalies


Interestingly, anomalies that are commonly recognized as behavior-driven, in particular, price momentum, are also observed in cryptocurrency markets. Price momentum describes the phenomenon that past winner (loser) assets may continue to outperform (underperform) in the future. The momentum effect turns out statistically significant and robust in various aspects. In contrast, risk-based anomalies, for example, return moment risks, are insignificant. The results are not surprising, as if the incentive for holding cryptocurrencies is largely speculative, it is not expected that exposure to certain form of risk earns a premium.

Unlike stock markets, short-term price reversal in cryptocurrency markets is very weak at a daily frequency. No evidence of long-term price reversal is revealed. This empirical finding makes cryptocurrency anomalies distinct from stock market anomalies.

What works

The most plausible explanation of cryptocurrency momentum is given by De Long, Shleifer, Summers, and Waldmann (1990). Their model implies that overconfident noise traders push up the price and create risk that makes fundamental traders reluctant to combat mispricing. If noise traders dominate, overpricing can be even more severe, as is the case of cryptocurrency markets, where speculators play the role of overconfident noise traders. Further, their model does not predict a long-term reversal as long as noise traders remain overconfident. This situation is analogous to cryptocurreny markets and consistent with the empirical findings of this paper. Moreover, their model implies an excessive volatility, another empirical stylized fact of cryptocurrency markets."


Are you looking for more strategies to read about? Check http://quantpedia.com/Screener

Do you want to see performance of trading systems we described? Check http://quantpedia.com/Chart/Performance

Do you want to know more about us? Check http://quantpedia.com/Home/About


Follow us on:

Facebook: https://www.facebook.com/quantpedia/

Twitter: https://twitter.com/quantpedia

Continue reading »

Size, Value and Equity Premium Waves

A new financial research paper has been published and is related to:

#25 – Small Capitalization Stocks (Size) Premium
#26 – Value (Book-to-Market) Anomaly

Author: Herskovic, Kind, Kung

Title: Size Premium Waves

Link: https://papers.ssrn.com/sol3/papers.cfm?abstract_id=3220825

Abstract:

This paper examines the link between microeconomic uncertainty and the size premium across different frequencies in an investment model with heterogeneous firms. We document that the observed time-varying dispersion in firm-specific productivity can account for a large size premium in the 1960's and 1970's, the disappearance in the 1980's and 1990's, and reemergence in the 2000's. Periods with a large (small) size premium coincide with high (low) microeconomic uncertainty. During episodes of high productivity dispersion, small firms increase their exposure to macroeconomic risks. Our model can also explain the strong positive low-frequency co-movement between size and value factors, but a negative relation with the market factor.

Notable quotations from the academic research paper:

"The relation between firm size and expected stock returns has varied signifi cantly over time in waves. Banz (1981) documented a size premium whereby firms with small market capitalizations earn higher expected returns than large ones before 1975, and that this size e ffect cannot be explained by market betas. The size e ffect subsequently vanished starting in the early 1980s to the late 1990s, before reemerging after 2000.

We also observe that measures of microeconomic uncertainty, such as the cross-sectional dispersion in plant- and firm-level total factor productivity (TFP), sales, and payouts, exhibit similar low-frequency patterns as the size premium.

size premium waves

Figure 1 illustrates that microeconomic uncertainty is strongly positively correlated with the size premium. In this paper, we demonstrate how persistent variation in microeconomic uncertainty can potentially rationalize the observed size premium waves.

To this end, we build a dynamic partial equilibrium production model with heterogeneous firms. The model has several distinguishing features. First, firms are subject to persistent idiosyncratic and aggregate TFP shocks with time-varying second moments. The second moment shocks to the idiosyncratic component capture time-varying cross-sectional dispersion in idiosyncratic productivity (microeconomic uncertainty) while the second moment shocks to the aggregate component capture fluctuations in macroeconomic uncertainty. Second, firms face quadratic adjustment costs and operating costs. Third, the representative household has recursive utility de fined over aggregate streams of consumption.

We find that our calibrated model produces a realistic size premium and captures the salient dynamics of the size premium across diff erent frequencies. Namely, the model generates a countercyclical size premium and reproduces the low-frequency wave patterns, including a large spread during 1960-1980, a disappearance between 1980-2000, and resurgence post-2000. The mean-reverting idiosyncratic TFP shocks helps to generate a negative relation between firm market capitalization and expected returns in the stationary distribution.

Small firms are those that have received a recent history of negative idiosyncratic shocks. Due to mean reversion, the shorter-term payouts of small fi rms therefore constitute a smaller share of aggregate payouts relative to their longer-term payouts. With a similar logic, the payout shares of large firms have the opposite pattern. Consequently, small firms are more exposed to aggregate long-run risks than large firms, which gives rise to a quantitatively signi ficant size premium.

The low-frequency fluctuations of the size premium in the model are driven by the persistent volatility process for idiosyncratic TFP shocks. When TFP dispersion is high, small fi rms are subjected to a larger history of negative idiosyncratic shocks that increases their exposure to longrun risks relative to periods with low TFP dispersion. As a result, the size premium is larger during periods of higher TFP dispersion. In the data, we find a very strong association between TFP dispersion and the size premium at low frequencies, consistent with the model predictions. Calibrating the idiosyncratic volatility process to our empirical measure, we show that our model can provide a quantitatively relevant account of the observed size premium waves.

equity premium

micro and macro uncertainity

The equity premium is strongly correlated with macroeconomic uncertainty, as measured by the realized volatility of consumption growth, output growth, and TFP, but negatively related to microeconomic uncertainty at low frequencies. The correlation between the equity premium and macroeconomic uncertainty is 0.76, while the correlation between the equity premium and microeconomic uncertainty is -0.64 (See Figures 3 & 4).

The model also generates signifi cant equity and value premia, inline with the observed magnitudes in the data. Persistent shocks to aggregate productivity growth are a source of long-run risk that help to generate a sizable equity premium when coupled with recursive preferences. Persistent second moment shocks to aggregate productivity growth generate a countercyclical equity premium.

equity premium

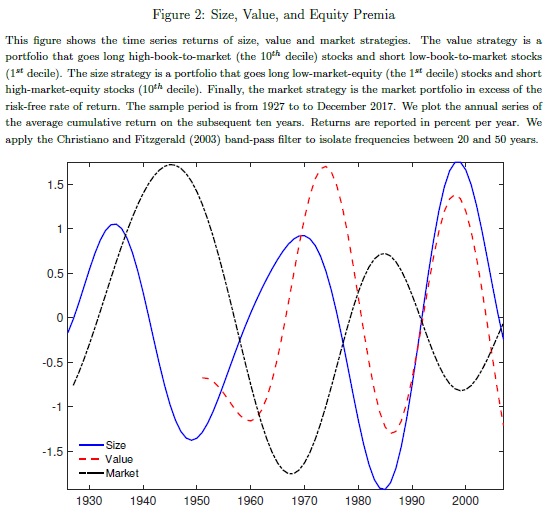
The size an value premia are strongly positively related at low frequencies (i.e., correlation of 0.66), but they are both negatively related with the equity premium at low frequencies (correlation between the size premium and the equity premium is -0.62 and the correlation between the value premium and the equity premium is -0.50). Figure 2 provides a visual depiction of these relations.

A value premium arises due to the combination of the asymmetric capital adjustment costs and operating costs, in a similar spirit as Zhang (2005). Firms with high book-to-market ratios have large stocks of capital, but have experienced a recent history of negative idiosyncratic shocks. Therefore, such firms have strong incentives to disinvest due to the low marginal product of capital and high operating costs, but the presence of capital adjustment costs prevents them from selling off their unproductive capital rapidly, which exposes high book-to-market (value) fi rms more to adverse aggregate shocks than low book-to-market (growth) firms. In particular, discouraging aggressive disinvestment policies prevents fi rms with large capital stocks from increasing payouts financed through capital sales in response to negative idiosyncratic shocks. The operating costs that are proportional to the capital stock of the firm reduce the funds available for payouts, especially for large fi rms. Therefore, these investment frictions imply that high book-to-market fi rms have low payout shares today, but higher payout shares at longer horizons due to mean reversion. Therefore, value firms are more exposed to long-run risks than growth firms, thereby generating a sizable value premium. The low-frequency fluctuations of the value premium are driven by the persistent idiosyncratic volatility process."


Are you looking for more strategies to read about? Check http://quantpedia.com/Screener

Do you want to see performance of trading systems we described? Check http://quantpedia.com/Chart/Performance

Do you want to know more about us? Check http://quantpedia.com/Home/About


Follow us on:

Facebook: https://www.facebook.com/quantpedia/

Twitter: https://twitter.com/quantpedia

Continue reading »

An Extensive Test of Market Timing Strategies in the Gold Market

Authors: Bartsch, Baur, Dichtl, Drobetz

Title: Investing in the Gold Market: Market Timing or Buy-and-Hold?

Link: https://papers.ssrn.com/sol3/papers.cfm?abstract_id=3202658

Abstract:

While the literature on gold is dominated by studies on its diversification, hedging, and safe haven properties, the question “When to invest in gold?” is generally not analyzed in much detail. We test more than 4,000 seasonal, technical, and fundamental timing strategies for gold. While we find large gains in economic terms relative to the buy-and-hold benchmark for several strategies, the results are robust to data-snooping biases only for selected technical trading strategies. These superior technical trading strategies outperform the buy-and-hold benchmark because they shift out of the gold market following a prolonged trend of negative gold market returns. We verify that the outperformance is not driven by a systematic reaction to the broader market environment and conclude that our results point to the presence of behavioral biases inducing gold market trends.

Notable quotations from the academic research paper:

"The question when to invest in gold has received remarkably little attention, while most research focuses on the diversification, hedging, and safe haven properties of gold. This study aims to close this gap by analyzing if an active investor can beat a passive buy-and-hold strategy by timing the gold market. For our evaluation period from January 1990 to December 2015, our back-test results for more than 4,000 different seasonal, technical, and fundamental trading strategies reveal that significant excess returns were possible.

To construct a comprehensive collection of market timing strategies, we build either on the economic properties of gold or incorporate the findings regarding previously surveyed anomalies in gold prices. In this section, we describe the strategies, rules, and variables used to predict gold returns.

Seasonal trading strategies:

Baur (2013) provides evidence for monthly seasonality in the gold market, with positive and statistically significant gold returns limited to the months September and November. Similar results are shown by Qi and Wang (2013) for the Chinese gold market and Naylor, Wongchoti, and Ith (2015) for U.S. gold ETF returns. To exploit this monthly anomaly, an investor could follow a simple strategy that invests in gold in September and November and reverts to holding cash in the remaining months. Although this strategy is supported by economic intuition, e.g., by the increased wedding season gold jewelry demand in India, the strategy itself is merely mechanic. Therefore, to address the concern that this strategy has simply been ‘mined’ from the data, we follow Dichtl and Drobetz (2014) and implement a more comprehensive approach: Each month, an investor can either be invested 100% in the gold market, or 100% in cash. In this vein, we obtain 212 = 4,096 different monthly seasonal allocation strategies, labeled from SEA0 to SEA4095, where SEA stands for seasonal.

Technical trading strategies:

Moskowitz, Ooi, and Pedersen (2012) find time series momentum in monthly returns of several liquid instruments, including gold futures. Therefore, we include monthly technical trading strategies based on moving average and momentum indicators in our empirical analyses. We invest in the gold market if the short moving average is above the long moving average and revert to holding cash otherwise. The short index for the moving average is set to = 1, 2, 3 and the long index to = 9, 12, which results in six moving average strategies. We also set = 1 and = 10, 24, 36, 48 to cover some other parameterizations that are popular in the literature and among investors. Overall, we employ ten different moving average strategies. We invest in gold if the gold market exhibits positive time series momentum. Otherwise, an allocation is taken in the cash market. Following Moskowitz, Ooi, and Pedersen (2012), we set = 1, 3, 6, 9, 12, 24, 36, 48 months.

Fundamental trading strategies:

Building on the economic properties of gold, a lot of researchers identify several fundamental factors that serve as predictors of future gold returns by affecting either the demand and supply of gold or market participants’ expectations thereof. To construct tradeable strategies based on these fundamental factors, we first estimate a simple linear regression model for each predictor variable (11 predictors in total) for forecasts of the spot price of gold. We also exploit the simple mean of all individual forecasts ( ) as another potential market timing strategy. We also consider a “kitchen sink” forecast ( ), which incorporates all available predictor variables simultaneously in a multivariate regression model.
performance of strategies

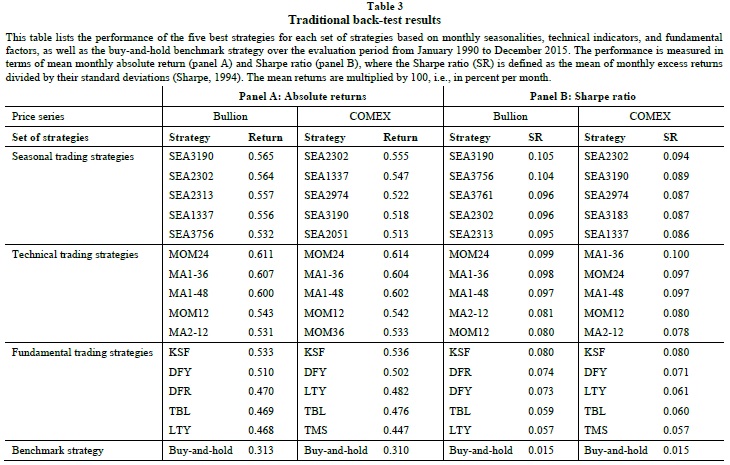
We measure the performance of our market timing strategies in terms of mean absolute returns and mean risk-adjusted excess returns, or Sharpe ratios (Sharpe, 1994), over the evaluation period. Table 3 lists the five best market timing strategies for each of the three strategy groups, i.e., seasonal trading strategies, technical trading strategies, and fundamental trading strategies.

Overall, while the results in Table 3 already provide a first indication which strategies perform well compared to the buy-and-hold strategy, these analyses neither test for statistical significance nor account for the data-snooping problem.

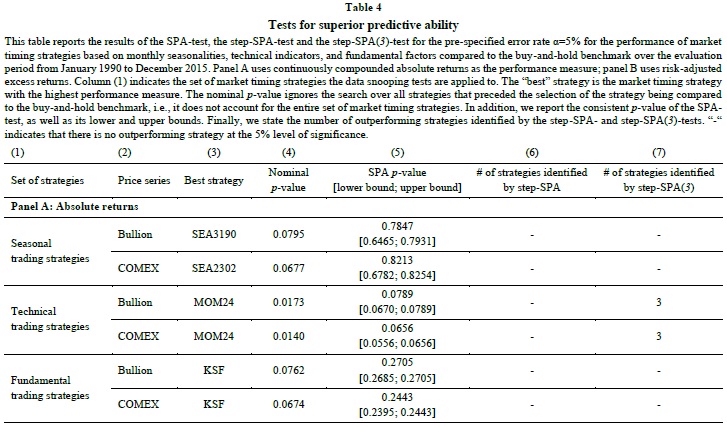
However, because all timing strategies are tested on the same data set, the observed outperformance may simply result from chance and not due to any robust relationship. To account for this data snooping bias, we apply a multiple testing framework and find that only a limited number of technical trading strategies show a statistically significant outperformance relative to the buy-and-hold strategy.

To assess the statistical significance of performance relative to buy-and-hold, while controlling for data snooping, we use Hansen’s (2005) SPA-test to all three types of strategies. In each test, the strategies are compared with the performance of the buy-and-hold benchmark. Accordingly, the first test considers all 4,095 different monthly seasonal trading strategies,12 the second test all 18 technical trading strategies, and the third test all 15 fundamental trading strategies. The SPA-test results are presented in Table 4.
test SPA

To further examine the characteristics of these superior technical trading strategies, we verify their long-term market timing ability using a conditional market model and preclude that their excess returns are compensation for crash risk, i.e. periods of persistent negative returns. Moreover, we find that the outperformance of these strategies is not driven by different economic and financial regimes. We thus conclude that the superiority of those timing strategies comes from the presence of behavioral biases in the gold market. As pointed out by Hurst, Ooi, and Pedersen (2013), trends emerge if market participants initially underreact to new information, possibly due to anchoring or conservatism. Trend-following strategies, such as time series momentum or moving-average rules, capitalize on the subsequent price changes, since the market price only gradually incorporates the full effect of the news. Once a trend has started, a delayed over-reaction may even exacerbate the trend, e.g., due to herding behavior, feedback trading, or biased self-attribution."


Are you looking for more strategies to read about? Check http://quantpedia.com/Screener

Do you want to see performance of trading systems we described? Check http://quantpedia.com/Chart/Performance

Do you want to know more about us? Check http://quantpedia.com/Home/About


Follow us on:

Facebook: https://www.facebook.com/quantpedia/

Twitter: https://twitter.com/quantpedia

Continue reading »

Predictability of Betting-Against-Beta Factor

A new financial research paper has been published and is related to:

#77 – Beta Factor in Stocks
#78 – Beta Factor in Country Equity Indexes

Author: Hedegaard

Title: Time-Varying Leverage Demand and Predictability of Betting-Against-Beta

Link: https://papers.ssrn.com/sol3/papers.cfm?abstract_id=3194626

Abstract:

The leverage aversion theory implies that returns to the betting-against-beta (BAB) strategy are predictable by past market returns: An outward shift in investors' aggregate demand function simultaneously increases market prices and increases the expected future BAB return. I confirm the prediction empirically and  find that the BAB strategy performs better in times when and in countries where past market returns have been high. I construct timing-strategies that are long BAB half the time and short BAB half the time, based on past market returns, and show that these timing strategies have realized strong historical performance.

Notable quotations from the academic research paper:

"In the Capital Asset Pricing Model (CAPM) of Sharpe (1964) and Lintner (1965), the risk of an asset is measured by its market beta and the expected return on an asset is proportional to its beta such that the relation between beta and expected returns, the security market line (SML), has a slope equal to the equity risk premium and an intercept equal to the risk-free rate. Empirically, Black et al. (1972) fi nds that the SML is too flat, and Black (1972) and Frazzini and Pedersen (2014) (FP hereafter) suggest that the at SML is due to leverage constrained investors.

Instead of applying leverage, constrained investors obtain an expected return higher than the expected return on the market by over-weighting high-beta stocks and under-weighting low-beta stocks in their portfolios, thereby lowering future risk-adjusted returns on high-beta stocks and increasing future risk-adjusted returns on low-beta stocks. FP construct a betting-against-beta (BAB) portfolio that goes long low-beta assets, leveraged to a beta of one, and short high-beta assets, also leveraged to a beta of one. The leverage aversion theory in FP predicts that the SML should be too flat on average and that the BAB factor should have a positive average return, which FP also find empirically.

I show that according to the leverage aversion theory, a shift in investors' aggregate demand function moves the economy to a new equilibrium in which both prices and expected returns on the BAB factor have changed. The eff ect of an outward shift in investors' demand function on the expected BAB return is theoretically ambiguous, since there are two opposing e ffects:

First, holding expected returns constant, constrained investors become more constrained and increase the over-weight to high-beta stocks, such that the expected return on the BAB factor increases.

Second, since prices increase and expected returns decline for markets to clear, the improvement in utility of over-weighting high-beta stocks decline, such that investors become less constrained and the expected BAB return declines.

Thus, if investors become more constrained following an outward shift in their demand functions, the shift leads to an increase in the expected BAB return, but if investors become less constrained it leads to a decrease in the expected BAB return.

It seems natural that investors become more constrained following an outward shift in their demand functions, and I show that empirically high past market returns forecast high future BAB returns and that daily market returns are negatively correlated with contemporaneous BAB returns. I demonstrate this for both U.S. BAB returns and international BAB returns, as well as for BAB factors formed from country indices.

I show that past market returns predict future BAB returns using both regressions, sorts, and by constructing a trading strategy. First, regressing BAB returns on contemporaneous and lagged market returns shows that daily BAB returns have a strong negative correlation with daily market returns and that past market returns positively predict future BAB returns. Second, sorting BAB returns on past market returns shows that realized BAB returns are higher following high past market returns. I demonstrate this e ffect for both the United States as well as for a sample of 23 other countries. Third, I construct BAB-timing strategies that take a position in the BAB factor in a given country proportional to the past 12 month market return of that country. Across the 24 international countries, the BAB timing strategies have generated positive alpha to a two-factor model with the market and BAB in all but 2 countries, and the alpha is signi ficant in 12 of the 24 countries.

Further, the variation in expected BAB returns coming from past returns is not only a time series e ffect, it is also a cross sectional e ect. I show that past market returns help explain cross-country di fferences in future BAB returns. Sorting countries based on their past market return shows that future BAB returns are higher in countries for which the past market return was higher than the cross-country average market return, and future BAB returns are lower in countries for which the past market return was below the cross-country average.

I also test the predictability of BAB using country indices. Here, the BAB strategy goes long country indices with a low beta to a global index and short indices with a high beta to a global index. FP show that the BAB strategy generates positive excess returns in a region of 13 developed countries, and extending their results I show that the BAB strategy also generates positive returns in a region of 25 emerging countries. Further, I show that in each region the returns on the BAB strategy are predictable by past returns on a cap-weighted index of the countries in the region."


Are you looking for more strategies to read about? Check http://quantpedia.com/Screener

Do you want to see performance of trading systems we described? Check http://quantpedia.com/Chart/Performance

Do you want to know more about us? Check http://quantpedia.com/Home/About


Follow us on:

Facebook: https://www.facebook.com/quantpedia/

Twitter: https://twitter.com/quantpedia
Continue reading »

Announcing QuantConnect & Quantpedia Cooperation

The Quantpedia site was created seven years ago and, over time, our pet project evolved into something bigger. We started small, but we always wanted to have a wide scope of strategies in our database. Our goal was to find, analyze, describe and categorize as many quant trading strategies as possible. Thus, we did not limit our focus to only one asset class, trading style, or instrument type.
 

Our database contains strategies on all asset classes (equities, bonds, commodities, etc.), trading styles, and popular instruments. However, this very broad approach brings one major issue: we’ve never had the resources to backtest the strategies we find in the thousands of academic research papers, so we could never independently validate them. Until now…


I am really excited to introduce our cooperation with QuantConnect. With the company’s resources and extensive database of historical data, combined with a backtesting engine, QuantConnect was able to start systematically backtesting strategies from our database. And now, we can finally start showing you out-of-sample backtests for some of our strategies.


If you’re unfamiliar, QuantConnect is a cloud-based algorithmic trading platform that enables its community of more than 60k quants, computer scientists, and engineers to backtest and deploy live strategies to brokerages such as Interactive Brokers and Coinbase Pro.

At the moment, QuantConnect has covered nearly 20 strategies and will continue to periodically add new strategy implementations in the future.

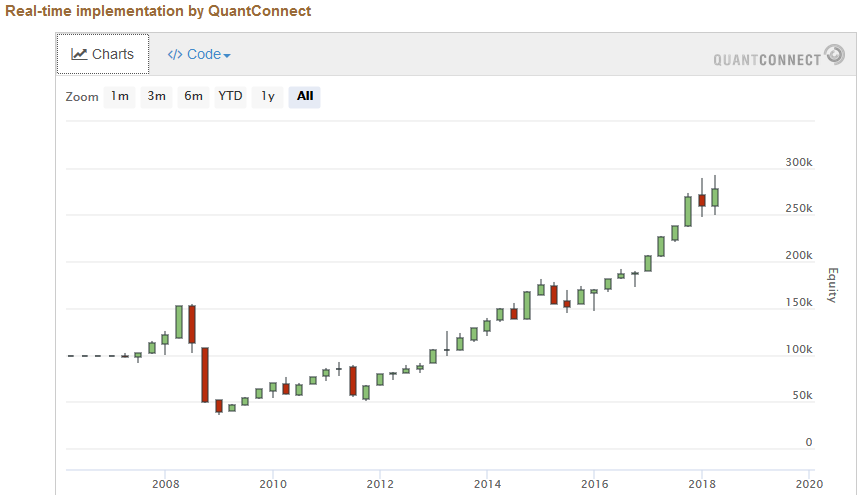
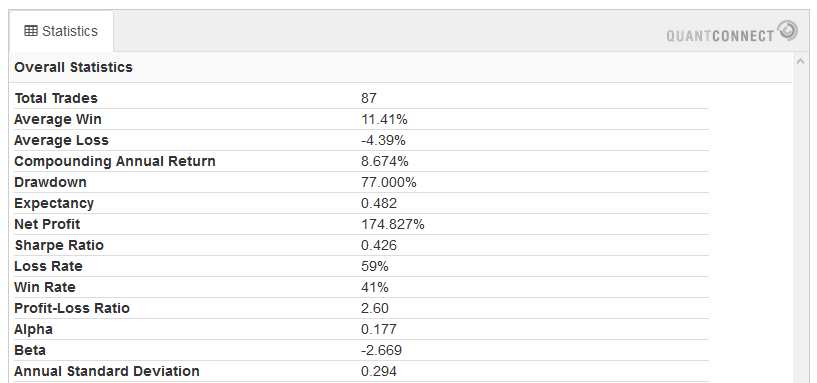
The QuantConnect out-of-sample backtests can be found at the bottom of Quantpedia strategy's subpage. Let’s look, for example, at strategy #2 – Asset Class Momentum. If you scroll down on that page, after a description of Asset Class Momentum strategy and links to source and related research papers, you’ll see a section with embedded code, an out-of-sample chart, and performance and risk statistics, all from QuantConnect.

Embedded code:
 

quantconnect code
 

An out-of-sample chart:
 

quantconnect chart
 

Performance and risk statistics:

quantconnect statistics
 

We plan to add a new field into our Screener (https://quantpedia.com/Screener) which will allow you to filter our strategies with QuantConnect backtests. Until then, a list of links to strategies that currently have this feature enabled is below:


#1 – Asset Class Trend Following (+ link to Quantconnect's subpage Asset Class Trend Following)
#2 – Asset Class Momentum (+ link to Quantconnect's subpage Asset Class Momentum)
#3 – Sector Momentum (+ link to Quantconnect's subpage Sector Momentum)
#4 – Overnight Anomaly (+ link to Quantconnect's subpage Overnight Anomaly)
#5 – Forex Carry Trade (+ link to Quantconnect's subpage Forex Carry Trade)
#7 – Volatility Effect in Stocks (+ link to Quantconnect's subpage Volatility Effect in Stocks)
#8 – Forex Momentum (+ link to Quantconnect's subpage Forex Momentum)
#12 – Pairs Trading (+ link to Quantconnect's subpage Pairs Trading – Cupola vs. Cointegration)
#13 – Short Term Reversal (+ link to Quantconnect's subpage Short Term Reversal)
#14 – Momentum Effect in Stocks (+ link to Quantconnect's subpage Momentum Effect in Stocks)
#15 – Momentum Effect in Country Equity Indexes (+ link to Quantconnect's subpage Momentum Effect in Country Equity Indexes)
#16 – Mean Reversion Effect in Country Equity Indexes (+ link to Quantconnect's subpage Mean Reversion Effect in Country Equity Indexes)
#18 – Liquidity Effect in Stocks (+ link to Quantconnect's subpage Liquidity Effect in Stocks)
#20 – Volatility Risk Premium Effect (+ link to Quantconnect's subpage Volatility Risk Premium Effect)
#21 – Momentum Effect in Commodities (+ link to Quantconnect's subpage Momentum Effect in Commodities)

#22 – Term Structure Effect in Commodities (+ link to Quantconnect's subpage Term Structure Effect in Commodities)
#25 – Small Capitalization Stocks Premium Anomaly (+ link to Quantconnect's subpage Small Capitalization Stocks Premium Anomaly)
#26 – Book-to-Market Value Anomaly (+ link to Quantconnect's subpage Book-to-Market Value Anomaly)


We are really thrilled that we can show you this new part of our analysis, and we are already looking forward to backtesting additional strategies with QuantConnect’s engine…


Are you looking for more strategies to read about? Check http://quantpedia.com/Screener

Do you want to see performance of trading systems we described? Check http://quantpedia.com/Chart/Performance

Do you want to know more about us? Check http://quantpedia.com/Home/About


Follow us on:

Facebook: https://www.facebook.com/quantpedia/

Twitter: https://twitter.com/quantpedia
Continue reading »

A Very Influential Paper About Tether-Bitcoin Relationship (Manipulation?)

Our recommended read to all parties interested in cryptocurrencies …

Authors: Griffin, Schams

Title: Is Bitcoin Really Un-Tethered?

Link: https://papers.ssrn.com/sol3/papers.cfm?abstract_id=3195066

Abstract:

This paper investigates whether Tether, a digital currency pegged to U.S. dollars, influences Bitcoin and other cryptocurrency prices during the recent boom. Using algorithms to analyze the blockchain data, we find that purchases with Tether are timed following market downturns and result in sizable increases in Bitcoin prices. Less than 1% of hours with such heavy Tether transactions are associated with 50% of the meteoric rise in Bitcoin and 64% of other top cryptocurrencies. The flow clusters below round prices, induces asymmetric auto-correlations in Bitcoin, and suggests incomplete Tether backing before month-ends. These patterns cannot be explained by investor demand proxies but are most consistent with the supply-based hypothesis where Tether is used to provide price support and manipulate cryptocurrency prices.

Notable quotations from the academic research paper:

"Our study examines the interaction between the largest cryptocurrency, Bitcoin, other major cryptocurrencies, and Tether, a cryptocurrency that accounts for more transaction volume than U.S. dollars. Tether is a cryptocurrency purportedly backed by U.S. dollar reserves and allows for dollar-like transactions without a banking connection, which many crypto-exchanges have difficulty obtaining or keeping. Although some in the blogosphere and press have expressed skepticism regarding the U.S. dollar reserves backing Tether, the cryptocurrency exchanges have largely rejected such concerns and widely use Tether in transactions.

In this paper, to shed light on the driving forces behind the recent boom of cryptocurrency markets, we focus on variants of two main alternative hypotheses for Tether: whether Tether is ’pulled’ (demand-driven), or ’pushed’ (supply-driven).

First, if Tether is ’pulled’ or demanded by investors who own fiat currency, the issuance of Tether facilitates the demand of these investors who value the flexibility of a digital currency and yet the stability of the dollar ’peg’. The demand for Tether could also arise because of its practicality for engaging in cross-exchange pricing arbitrage.

Alternatively, if Tether is ’pushed’ on market participants, Bitfinex supplies Tether regardless of the demand from investors with fiat currency to purchase Bitcoin and other cryptocurrencies. The acquired Bitcoins can then gradually be converted into dollars. In this setting, the Tether creators have several potential motives. First, if the Tether founders, like most early cryptocurrency adopters and exchanges, are long on Bitcoin, they have a large incentive to create an artificial demand for Bitcoin and other cryptocurrencies by ’printing’ Tether. Similar to the inflationary effect of printing additional money, this can push cryptocurrency prices up. Second, the coordinated supply of Tether creates an opportunity to manipulate cryptocurrencies. When prices are falling, the Tether creators can convert their Tether into Bitcoin in a way that pushes Bitcoin up and then sell some Bitcoin back into dollars to replenish Tether reserves as Bitcoin price rises. Finally, if cryptocurrency prices crash, Tether creators essentially have a put option to default on redeeming Tether, or to potentially experience a ’hack’ where Tether or related dollars disappear. Both the ’pushed’ and ’pulled’ alternatives have different testable implications for flows and cryptocurrency returns that we can take to the powerful blockchain data.

We begin our exercise by collecting and analyzing both the Tether and Bitcoin Blockchain data through a series of algorithms we implement to reduce the complexity of analyzing the blockchain. Tether is created, moved to Bitfinex, and then slowly moved out to other crypto-exchanges, mainly Poloniex and Bittrex. Interestingly, almost no Tether returns to the Tether issuer to be redeemed, and the major exchange where Tether can be exchanged for USD, Kraken, accounts for only a small proportion of transactions.

We then examine the flow of coins identified above to understand whether Tether is pushed or pulled, and examine the effect of Tether, if any, on Bitcoin prices. First, following periods of negative Bitcoin return, Tether flows to other exchanges are used to purchase Bitcoin. Second, these flows seem to have a strong effect on future Bitcoin prices. They are present only after periods of negative returns and periods following the printing of Tether, that is, when there is likely an oversupply of Tether in the system. A placebo test finds no evidence of Bitcoin price movements following large flows of Bitcoin from Poloniex and Bittrex to major exchanges other than Bitfinex. This phenomenon strongly suggests that the price effect is driven by Tether issuances.

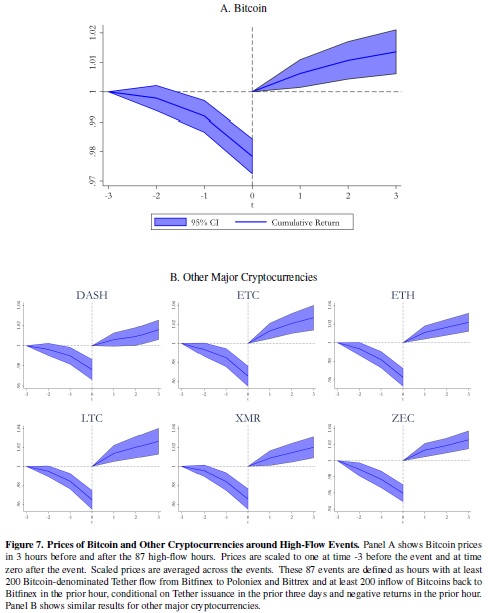
To illustrate the potential magnitude and predictive effect of Tether issuances on Bitcoin prices, we focus on the hours with the largest lagged combined Bitcoin and Tether flows on the two blockchains. These 87 hours have large negative returns before the flows but are followed by large return reversals. These 87 events account for less than 1% of our time series (over the period from the beginning of March 2017 to the end of March 2018), yet are associated with 50% of Bitcoin’s compounded return, and 64% of the returns on six other large cryptocurrencies (Dash, Ethereum Classic, Ethereum, Litecoin, Monero, and Zcash).

Consistent with Tether being used to buy Bitcoin when prices drop, we find a statistically and economically strong reversal in Bitcoin prices, but only following negative returns. The Bitcoin reversal did not exist before Tether was prevalent in the market and disappears during the period when Tether stops being printed.

Bitcoin reversal

The results are consistent with the Tether issuers pushing out Tether to stabilize the price of Bitcoin, but we investigate these issues further. Investors hoping to stabilize and drive up the price might concentrate on certain price thresholds as an anchor or price floor. This follows the idea that if investors can demonstrate a price floor, then they can induce other traders to purchase. Interestingly, Bitcoin purchases by Bitfinex strongly increase just below multiples of 500. This pattern is only present in periods following printing of Tether and not observed by other exchanges. To address causality, we use the discontinuity in Tether flow at the round threshold cutoffs as an instrument to measure the effect of Tether on Bitcoin prices. The instrumental regression results are even stronger, indicating that Tether flows are causing the positive return.

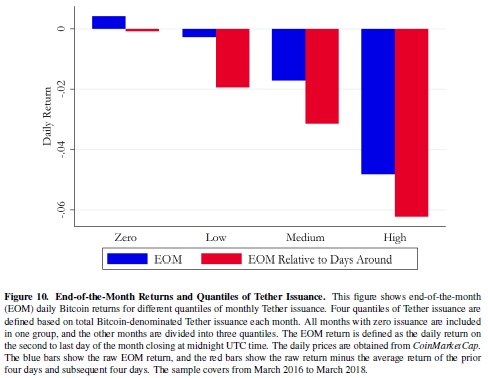
If Tether is pushed out to other crypto exchanges rather than demanded by investors with dollars in hand, Tether may not be fully backed by dollars when issued. However, if the issuers wished to post monthly bank statements to shore up dollar reserves and appear fully backed, this would necessitate the liquidation of the purchased Bitcoins at the end-of-the-month (EOM). Interestingly, we find a significant negative EOM abnormal return of 6% in the months with strong Tether issuance. The EOM Bitcoin returns are highly correlated with the magnitude of Tether issuance, and no abnormal returns are observed in months when Tether is not issued.

EOM bitcoin

Our results are consistent with Tether being pushed out onto the market and not primarily driven by investors’ demand, but we nevertheless further examine two direct implications of the ’pulled’ hypotheses. In particular, we examine if the flows of Tether bear much relation to a proxy for its demand from investors, the premium for Tether relative to the U.S. Dollar exchange rate. We find little evidence to support this hypothesis. Another related alternative is that the crossexchange arbitrage to eliminate pricing discrepancies across exchanges is the primary driver of the Tether flow, but this hypothesis is not supported by the data. Although we find little support for demand-based proxies, we hypothesize that there are some sources for legitimate demand for Tether, however, those are not the ones that dominate the flow patterns observed in the data.

"


Are you looking for more strategies to read about? Check http://quantpedia.com/Screener

Do you want to see performance of trading systems we described? Check http://quantpedia.com/Chart/Performance

Do you want to know more about us? Check http://quantpedia.com/Home/About


Follow us on:

Facebook: https://www.facebook.com/quantpedia/

Twitter: https://twitter.com/quantpedia

Continue reading »