
Quantpedia is The Encyclopedia of Quantitative Trading Strategies
We've already analyzed tens of thousands of financial research papers and identified more than 1000 attractive trading systems together with thundreds of related academic papers.
- Unlock Screener & 300+ Advanced Charts
- Browse 1000+ uncommon trading strategy ideas
- Get new strategies on bi-weekly basis
- Explore 2000+ academic research papers
- View 800+ out-of-sample backtests
- Design multi-factor multi-asset portfolios
The short-term reversal in stock returns is already a well known and well-established anomaly that appears to contradict the weak-form market efficiency. Strategy based on this anomaly buys past winners and sells past losers. A possible and sensible explanation of the short-term reversal phenomenon is the overreaction of investors. Research in the past focused primarily on noise trading and ignored the important role of fundamental information. Curiously, new research suggests that there is a need to study the impact of fundamental news on short-term return reversals where a nonparametric metric of fundamental strength (FSCORE) is used to measure the impact from fundamental information. The need to measure the impact mentioned above is clear - there is overwhelming evidence that investors underreact to fundamental news. Moreover, fundamental information metric has a persistent predictive effect on stock returns, which is consistent with the hypothesis of the slow diffusion of information and investor underreaction. Simply said, high FSCORE firms tend to earn much higher returns than low FSCORE firms. The paper has found significant evidence that recent losers with strong fundamental strength and recent winners with weak fundamental strength experience stronger reversals than other reversal portfolio strategies. A fundamental-anchored reversal strategy exploits this finding, and this reversal strategy could generate a high significant average monthly returns that outperform the profit from the unconditional and traditional reversal strategy. The paper primarily studies all common stocks; however, we present the data about large stocks since the small stocks bear their own unique features.
Fundamental reason
There are three reasons to use FSCORE. Firstly, FSCORE is a comprehensive metric of a firm’s fundamental strength, because this score synthesizes information from nine signals along three dimensions of a firm’s financial performance (profitability, change in financial leverage and liquidity, and change in operational efficiency). Secondly, the fundamental information is gathered directly from the financial statements, which obviates the measurement error problem. And lastly, FSCORE is a nonparametric measure, compared with a parametric approach, FSCORE is more robust and helps to reduce concerns over potential estimation biases. Results support the hypothesis that short-term reversals are influenced by both noise trading and investor underreaction to fundamental information. Also results from regression analysis suggest that both noise trading and fundamental information significantly influence stock returns on the short horizon. No doubt, there is a conclusion that investor underreaction to fundamental information coupled with noise trading can explain the observed empirical patterns in short-term reversals. Moreover, results indicate that the bid-ask spread cannot be the main source of the profitability for short-term reversals, and the results are not particularly sensitive to alternative definitions of fundamental strength. Last but not least, simple short-term reversal and industry-adjusted reversal strategies fail to be profitable in the presence of transaction costs; however, fundamental anchored reversal strategies are economically profitable even in the presence of transaction costs.
Get Premium Strategy Ideas & Pro Reporting
- Unlock Screener & 300+ Advanced Charts
- Browse 1000+ unique strategies
- Get new strategies on bi-weekly basis
- Explore 2000+ academic research papers
- View 800+ out-of-sample backtests
- Design multi-factor multi-asset portfolios
Strategy profile
- Market factors
- Equities
- Financial instruments
- Stocks
- Regions
- United States
- Number of traded instruments
- 1000
more or less, it depends on investor's need for diversification, common stocks (share code 10 or 11) listed in NYSE, AMEX and NASDAQ exchanges. Stocks with prices less than $5 at the end of formation period are excluded.
- Complexity
- Very Complex
- Rebalancing period
- Monthly
- Confidence in anomaly's validity
- Moderate
OOS back-test shows slightly negative performance. It looks, that strategy's alpha is deteriorating in the out-of-sample period.
- Transaction costs
- Included
Section 5.1/Table 11 deducts estimated bid-ask transaction costs from FAR returns. Costs use each leg's portfolio turnover times its direct half effective spread: FAR long/short turnover 86.34%/85.75% and spreads 0.687%/0.664%, yielding a 1.16% monthly cost; its 1.82% raw monthly return becomes a 0.66% net monthly return. The estimates do not specifically isolate the large-stock subsample.
- Robustness checks
- Assessed
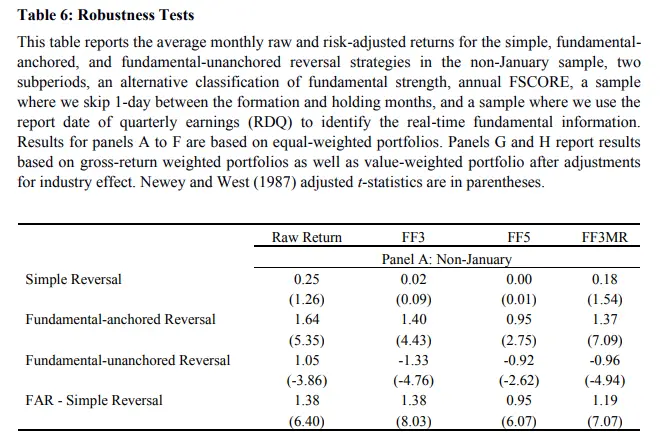
The FAR strategy is tested across non-January months, 1984–99 versus 2000–15, alternative FSCORE cutoffs, annual rather than quarterly FSCORE, a one-day skip to address bid-ask effects, RDQ-based real-time information, gross-return weighting, industry-adjusted value weighting, and stock-characteristic subsamples (Tables 6–8). Results remain positive in all listed FAR variants, including 1.35% raw monthly after a one-day skip and 0.92% with industry-adjusted value weights (Table 6). In the size check, FAR earns 0.95% raw per month among large stocks (Table 7, Panel A), indicating the result persists, though it is stronger among small stocks (2.42%).
Source-paper performance
- Backtest period
- 1984 – 2015
- Indicative performance
- 12.01%
data from table 6, Panel A, Large stocks, annualized monthly performance (0,95%)
- Estimated volatility
- 20.61%
data from table 6, Panel A, Large stocks, annualized monthly volatility computed from t-stat (3,08)
- Maximum drawdown
- -59.02%
not stated
- Sharpe ratio
- 0.39
Simple trading strategy
The investment universe consists of common stocks (share code 10 or 11) listed in NYSE, AMEX, and NASDAQ exchanges. Stocks with prices less than $5 at the end of the formation period are excluded.
The range of FSCORE is from zero to nine points. Each signal is equal to one (zero) point if the signal indicates a positive (negative) financial performance. A firm scores one point if it has realized a positive return-on-assets (ROA), positive cash flow from operations, a positive change in ROA, a positive difference between net income from operations (Accrual), a decrease in the ratio of long-term debt to total assets, a positive change in the current ratio, no-issuance of new common equity, a positive change in gross margin ratio and lastly a positive change in asset turnover ratio. Firstly, construct a quarterly FSCORE using the most recently available quarterly financial statement information.
Monthly reversal data are matched each month with a most recently available quarterly FSCORE. The firm is classified as a fundamentally strong firm if the firm’s FSCORE is greater than or equal to seven (7-9), fundamentally middle firm (4-6) and fundamentally weak firm (0-3). Secondly, identify the large stocks subset - those in the top 40% of all sample stocks in terms of market capitalization at the end of formation month t. After that, stocks are sorted on the past 1-month returns and firm’s most recently available quarterly FSCORE. Take a long position in past losers with favourable fundamentals (7-9) and simultaneously a short position in past winners with unfavourable fundamentals (0-3). The strategy is equally weighted and rebalanced monthly.
For those interested in systematic quantitative value factor ETF implementation, here is a link to the Alpha Architect Quantitative Value ETF (strategy background).
Hedge for stocks during bear markets
Yes – Equity reversal strategy is usually a type of "liquidity providing" strategy, and as such, they usually perform well during market crises. However, reversal strategy is also naturally a "short volatility" strategy; its return increase mainly in the weeks following large stock market declines. Traders must be cautious during crises during days with high volatility as reversal strategies usually force traders to buy stocks which performed especially bad (and to sell short stocks with an extremely positive short term performance). This position is emotionally hard to open, and risk management of reversal strategies must also be very strict during these days. We recommend reading a research paper by Nagel: "Evaporating Liquidity" to gain insight into the behaviour of reversal strategies during crises.
Out-of-sample strategy implementation in QuantConnect (chart, statistics & code)
Related picture
Source paper
Zhu, Zhaobo and Sun, Licheng and Chen, Min: Noise Trading, Slow Diffusion of Information, and Short-Term Reversals: A Fundamental Analysis Approach
Abstract: Contrary to the conventional wisdom that short-term return reversals are rooted in investors’ overreaction to fundamental news or driven by liquidity-based noninformational shocks alone, we find strong evidence that both noise trading and investor underreaction to fundamental information contribute to the reversal. With help from a comprehensive and nonparametric measure of firms’ fundamental strength, we document that an enhanced short-term reversal strategy that buys past losers with strong fundamentals and sells past winners with weak fundamentals significantly outperforms the unconditional reversal strategy. Our findings are consistent with the predictions of theoretical models where investors underreact to slowly diffusing fundamental information.
Other papers
Salas Najera, Carlos: The Evolution of Fundamental Scoring Models and Machine Learning Implications
Abstract: “Man+Machine” is a series of articles where the reader can find guidance on how to bridge the gap between fundamental analysis knowledge and new data science/ML/AI methods. This first article will provide an overview of the historical evolution of systematic fundamental scoring models, and an introductory analysis of how Machine Learning (ML) is transforming and enhancing these traditional indicators. This article is designed to briefly introduce readers without prior knowledge of fundamental scoring models.
Hasan, Iftekhar and Shen, Jianfu and Ng, Chi Cheong: Do Institutional Investors Exploit Expectation Errors in Value/Glamour Stocks?
Abstract: This study examines the institutional demand for mispriced stocks with incongruent expectations implied by book-to-market ratio and financial strength. Consistent with the argument of expectation errors in value/glamour stocks (Piotroski and So, 2012), institutional investors buy value stocks with strong fundamentals (underpriced) and sell glamour stocks with weak fundamentals (overpriced). Independent institutions are more likely to take advantage of the mispricing in value/glamour firms than passive institutions. Changes in institutional ownership concentrate on stocks with more limits or restrictions on arbitrage. Institutional trading on expectation errors attenuates the book-to-market anomaly and the abnormal returns to mispriced stocks. Institutional trading patterns on mispriced value/glamour stocks are also documented in global markets.