
Quantpedia is The Encyclopedia of Quantitative Trading Strategies
We've already analyzed tens of thousands of financial research papers and identified more than 1000 attractive trading systems together with thundreds of related academic papers.
- Unlock Screener & 300+ Advanced Charts
- Browse 1000+ uncommon trading strategy ideas
- Get new strategies on bi-weekly basis
- Explore 2000+ academic research papers
- View 800+ out-of-sample backtests
- Design multi-factor multi-asset portfolios
Several research papers show that investor sentiment, also known as market sentiment, plays a part in market returns. Market sentiment refers to the general mood on the financial markets and investors’ overall tendency to trade. There are two types of mood on the market: bullish and bearish. Rising prices indicate bullish sentiment, while falling prices indicate bearish sentiment.
There are numerous ways to measure sentiment in the financial markets. Traditional sentiment indicators include the CBOE Volatility Index (VIX), High-Low Index or Bullish Percent Index (BPI). Another way to measure sentiment is by using various news sources, social media or other market sentiment indicators. This paper shows various ways to measure market sentiment and its influence on returns.
Additionally, traders have noticed that the US stocks have significantly higher return during the night sessioncompared to the daily session. Multiple academic studies have confirmed this suspicion and found that the US equity premium is mostly due to overnight returns. This paper looks at an overnight anomaly combined with three market sentiment indicators, including Brain Market sentiment indicator, VIX and the short-term trend in SPY ETF.
Fundamental reason
There are numerous possible reasons, which can explain an overnight anomaly. Academic studies show that part of the reason for an overnight anomaly is the high opening prices derived from the accumulation of market orders from market participants, which subsequently decline in the first hour of trading. Some portion of positive overnight returns can be expected due to an illiquidity premium, but liquidity can explain only a small part of the night and day return difference.
Additionally, the explanation for market sentiment is pretty simple. When the sentiment is bullish the general mood on the market is good which means the investors tend to buy more, which makes the mood even better. On the other hand, when the sentiment is bearish the general mood on the market is not so good which means the investors tend to buy less, which makes the mood even worse.
Get Premium Strategy Ideas & Pro Reporting
- Unlock Screener & 300+ Advanced Charts
- Browse 1000+ unique strategies
- Get new strategies on bi-weekly basis
- Explore 2000+ academic research papers
- View 800+ out-of-sample backtests
- Design multi-factor multi-asset portfolios
Strategy profile
- Market factors
- Equities
- Financial instruments
- ETFs
- Regions
- United States
- Number of traded instruments
- 1
SPY ETF
- Complexity
- Moderate
- Rebalancing period
- Daily
- Confidence in anomaly's validity
- Strong
- Transaction costs
- Excluded
Transaction costs were not added to the calculations for the overnight strategy/20-day equally weighted portfolio. The authors state that costs would be high and non-negligible because of trading frequency, but provide no numerical cost assumption (Conclusion, p. 7; also Abstract, p. 1).
- Robustness checks
- Assessed
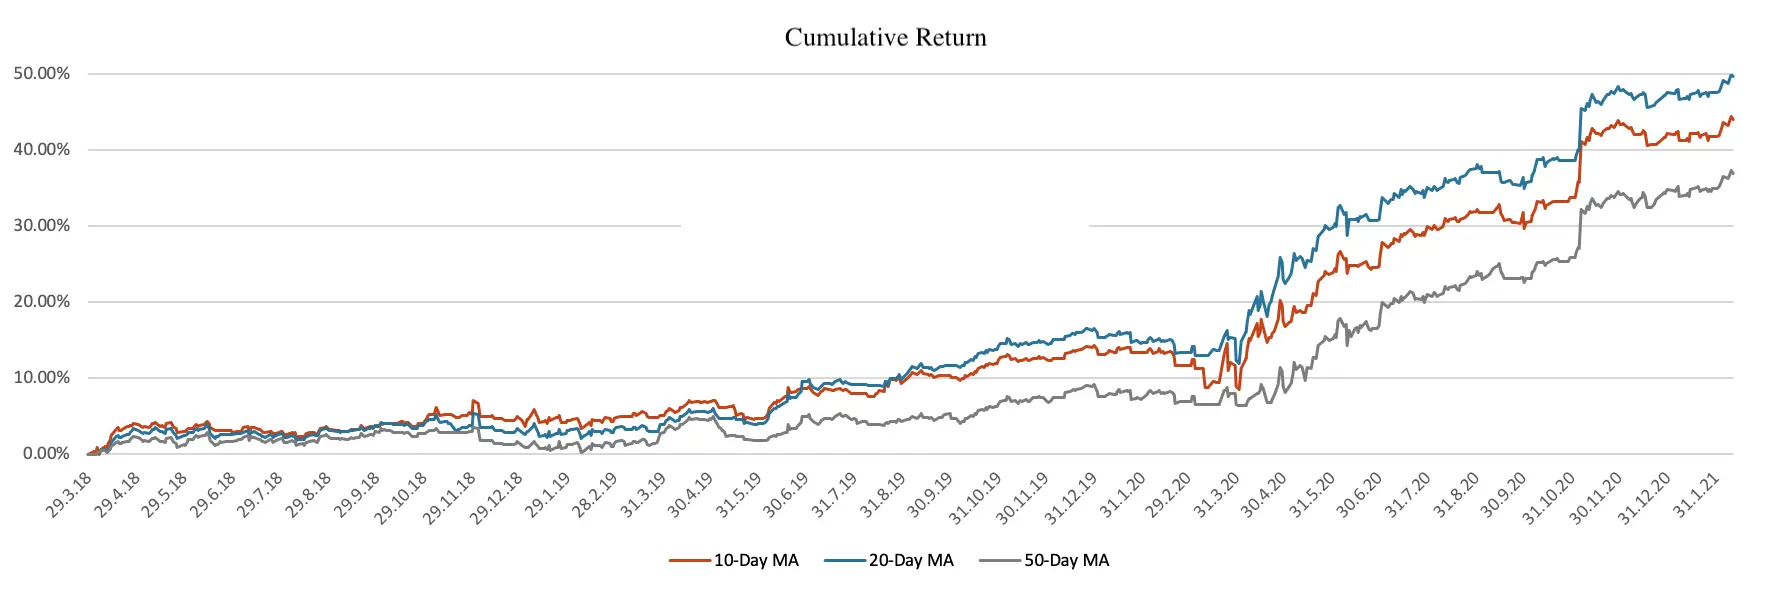
The equally weighted combination of the SPY, VIX, and BMS overnight-signal portfolios was tested using alternative moving-average windows of 10, 20, and 50 days (pp. 4–5). The 20-day version had the highest reported return and Sharpe ratio (15.58% p.a.; Sharpe 2.12), while the 10- and 50-day variants also had positive performance and Sharpe ratios of 1.80 and 1.78. The authors additionally tested a prior-overnight-return filter on the 20-day equally weighted portfolio (pp. 5–6); it reduced return to 11.67% p.a. and left the Sharpe ratio broadly unchanged (2.10 versus 2.12), so they conclude that the added filter does not improve the portfolio and discourage its use.
Source-paper performance
- Backtest period
- 2018 – 2021
- Indicative performance
- 15.58%
Table on page 5, Equally-Weighted Portfolio, 20-day MA
- Estimated volatility
- 7.33%
Table on page 5, Equally-Weighted Portfolio, 20-day MA
- Maximum drawdown
- -10.97%
Table on page 5, Equally-Weighted Portfolio, 20-day MA
- Sharpe ratio
- 2.12
Simple trading strategy
The investment universe consists of SPY ETF, and the price of SPY, price of VIX and Brain Market Sentiment (BMS) indicator are used to identify the market sentiment. The investor buys SPY ETF and holds it overnight; when the price of SPY is above its 20-day moving average, the price of VIX is below its moving average, and the value of the BMS indicator is greater than its 20-day moving average.
Note that the authors suggest using this strategy as an overlay when deciding whether to make a trade rather than using this system on its own.
Hedge for stocks during bear markets
Partially – Strategy’s goal is to hold equity portfolio only in positive times (low risk and low volatility times) and otherwise be out of equities. So, it could be expected that the strategy would not suffer significant drawdowns since it would not be invested at all.
Out-of-sample strategy implementation in QuantConnect (chart, statistics & code)
Related picture
Source paper
Vojtko, Hanicová: Market Sentiment and an Overnight Anomaly
Abstract: Various research shows that market sentiment, also called investor sentiment, plays a role in market returns. Market sentiment refers to the general mood on the financial markets and investors' overall tendency to trade. The mood on the market is divided into two main types, bullish and bearish. Naturally, rising prices indicate bullish sentiment. On the other hand, falling prices indicate bearish sentiment. This paper shows various ways to measure market sentiment and its influence on returns.Additionally, we take a look at an overnight anomaly in combination with three market sentiment indicators. We analyse the Brain Market sentiment indicator in addition to VIX and the short-term trend in SPY ETF. Our aim is not to build a trading system. Instead, it is to analyse financial markets behaviour. Overall the transaction costs of this kind of strategy would be very high. However, more appropriate than using this system on its own would be to use it as an overlay when deciding when to make trades.