
Quantpedia is The Encyclopedia of Quantitative Trading Strategies
We've already analyzed tens of thousands of financial research papers and identified more than 1000 attractive trading systems together with thundreds of related academic papers.
- Unlock Screener & 300+ Advanced Charts
- Browse 1000+ uncommon trading strategy ideas
- Get new strategies on bi-weekly basis
- Explore 2000+ academic research papers
- View 800+ out-of-sample backtests
- Design multi-factor multi-asset portfolios
The short-term contrarian strategy of buying stocks, which are past losers and selling stocks, which are past winners, is well documented in the academic literature. But does this affect work within different markets and with different instruments?
Recent research shows that short term reversal works not only in the equity market, but it is also applicable to futures. Research also suggests that trading volume contains information about future market movements. This "forecastability" can be enhanced with open interest as it provides an additional measure of trading activity. Therefore this contrarian strategy is most profitable if it is implemented on high-volume low-open interest contracts.
Fundamental reason
Evidence of short-horizon return predictability is consistent with the overreaction hypothesis; namely, traders over-adjust their posterior beliefs to news more than it is warranted by fundamentals. Overconfidence and overreaction themselves imply a large volume of trading, and they are thus positively related to the magnitude of price reversals. Therefore an irrationality-induced market inefficiency gives rise to a negative relation between volume and expected returns. Open interest represents uninformed trading by hedgers or hedging activity and thus is also an important determinant of the market state.
Get Premium Strategy Ideas & Pro Reporting
- Unlock Screener & 300+ Advanced Charts
- Browse 1000+ unique strategies
- Get new strategies on bi-weekly basis
- Explore 2000+ academic research papers
- View 800+ out-of-sample backtests
- Design multi-factor multi-asset portfolios
Strategy profile
- Market factors
- EquitiesBondsCommoditiesCurrencies
- Financial instruments
- FuturesCFDs
- Regions
- United States
- Number of traded instruments
- 6
number of opened futures contracts with different backing
- Complexity
- Simple
- Rebalancing period
- Weekly
- Confidence in anomaly's validity
- Strong
- Transaction costs
- Mentioned
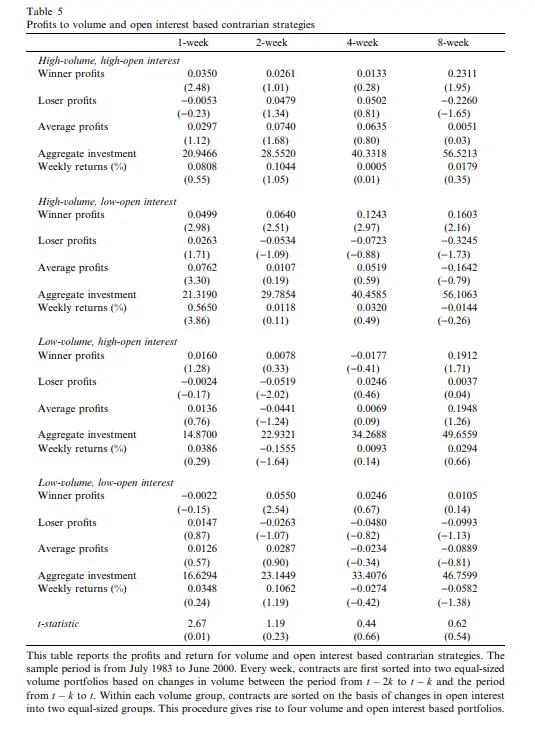
Section 3.3/Table 6 deducts one-way commissions plus one-half bid–ask spread from the basic 1-week contrarian strategy, using assumed costs of 0.01%, 0.05%, 0.10%, and 0.20% per dollar transaction; it remains profitable through 0.10%, and about 0.16% eliminates profits. The Table 5 high-volume/low-open-interest strategy’s reported 0.57% weekly return is not reported net of these costs.
- Robustness checks
- Assessed
Section 3.4 retests the conditional volume/open-interest contrarian strategy using percentage rather than value changes in trading activity: the high-volume/low-open-interest portfolio remains the only significant strategy, earning 0.50% weekly (t=3.45; 26% annualized). The authors also report that alternative winner/loser portfolio weights yield a consistent conditional-return pattern, with larger profits. Section 2.1 additionally reports generally consistent, unreported Friday-to-Friday results.
Source-paper performance
- Backtest period
- 1983 – 2000
- Indicative performance
- 29.64%
per annum, calculated as annualized (arithmetically) weekly returns (0.57%) for long short portfolio from table 5, weekly return to the contrarian portfolio is obtained by dividing the total profits by total long or short investment
- Estimated volatility
- 31.4%
estimated from t-statistic
- Maximum drawdown
- -58.65%
not stated
- Sharpe ratio
- 0.82
Simple trading strategy
The investment universe consists of 24 types of US futures contracts (4 currencies, five financials, eight agricultural, seven commodities). A weekly time frame is used - a Wednesday- Wednesday interval. The contract closest to expiration is used, except within the delivery month, in which the second-nearest contract is used. Rolling into the second nearest contract is done at the beginning of the delivery month.
The contract is defined as the high- (low-) volume contract if the contract's volume changes between period from t-1 to t and period from t-2 to t-1 is above (below) the median volume change of all contracts (weekly trading volume is detrended by dividing the trading volume by its sample mean to make the volume measure comparable across markets).
All contracts are also assigned to either high-open interest (top 50% of changes in open interest) or low-open interest groups (bottom 50% of changes in open interest) based on lagged changes in open interest between the period from t-1 to t and period from t-2 to t-1. The investor goes long (short) on futures from the high-volume, low-open interest group with the lowest (greatest) returns in the previous week. The weight of each contract is proportional to the difference between the return of the contract over the past one week and the equal-weighted average of returns on the N (number of contracts in a group) contracts during that period.
Hedge for stocks during bear markets
Partially – The source research paper doesn't offer insight into the correlation structure of the proposed trading strategy to equity market risk; therefore, we do not know if this strategy can be used as a hedge/diversification during the time of market crisis. Short term reversal strategy is usually a type of "liquidity providing" strategy, and as such, it usually performs well during market crises. However, reversal strategy is also naturally a "short volatility" strategy; its return increases mainly in the weeks following large stock market declines. Traders must be cautious during crisis during days with high volatility as a reversal strategy usually force traders to buy assets which performed especially bad (and to sell short assets with an extremely positive short term performance).
Out-of-sample strategy implementation in QuantConnect (chart, statistics & code)
Related picture
Source paper
Wang, Yu: Trading activity and price reversals in futures markets
Abstract: We use the standard contrarian portfolio approach to examine short-horizon return predictability in 24 US futures markets. We find strong evidence of weekly return reversals, similar to the findings from equity market studies. When interacting between past returns and lagged changes in trading activity (volume and/or open interest), we find that the profits to contrarian portfolio strategies are, on average, positively associated with lagged changes in trading volume, but negatively related to lagged changes in open interest. We also show that futures return predictability is more pronounced if interacting between past returns and lagged changes in both volume and open interest. Our results suggest that futures market overreaction exists, and both past prices and trading activity contain useful information about future market movements. These findings have implications for futures market efficiency and are useful for futures market participants, particularly commodity pool operators.
Other papers
Zhi Da, Ke Tang, Yubo Tao and Liyan Yang: Financialization and Commodity Markets Serial Dependence
Abstract: Recent financialization in commodity markets makes it easier for institutional investors to trade a portfolio of commodities via various commodity-indexed products. We present several pieces of novel causal evidence that daily exposure to such index trading results in price overshoots and reversals, as reflected in a negative daily return autocorrelations, only among commodities in that index. This is because index trading propagates non-fundamental noises to all indexed commodities. We present direct evidence for such noise propagation using commodity news sentiment data.
Micaletti, Raymond: A Comparison of Short-Term Mean-Reversion Indicators for Global Equities
Abstract: We examine an array of short-term mean-reversion indicators for global equities. The indicators encompass the most widely known price oscillators from the field of technical analysis along with several modified versions first developed by the author in the 2009- 2010 time frame. Constructing simple trading strategies from a wide range of indicator parameters, triggering thresholds, and holding periods, we find the modified oscillators tend to dominate the performance rankings on both the long and short sides of the market. Consequently, this study may serve as a point of reference for day traders, swing traders, or even asset managers looking to better time their rebalances.