
Quantpedia is The Encyclopedia of Quantitative Trading Strategies
We've already analyzed tens of thousands of financial research papers and identified more than 1000 attractive trading systems together with thundreds of related academic papers.
- Unlock Screener & 300+ Advanced Charts
- Browse 1000+ uncommon trading strategy ideas
- Get new strategies on bi-weekly basis
- Explore 2000+ academic research papers
- View 800+ out-of-sample backtests
- Design multi-factor multi-asset portfolios
The net current asset value (NCAV/MV) strategy is the famous strategy popularized (and used) by the father of security analysis, Benjamin Graham, in the early twentieth century, bringing high profits from the 1930s to 1956. Per-share NCAV, as defined by Graham (Graham and Dodd (1934), Graham (1976)), is the balance sheet current assets minus all the firm's (current and long-term) liabilities divided by the number of shares outstanding. Long-term assets (e.g., intangible assets and fixed assets) values are not counted.
Graham found that companies satisfying the NCAV/MV strategy were often priced at significant discounts to estimates the value that stockholders could receive in the event of the actual sale or liquidation of the entire corporation. Thus, the NCAV/MV rule not only protects capital from significant permanent loss but also generates a portfolio of stocks with excellent prospects for an advance in price.
Fundamental reason
The NCAV rule forms portfolios filled with stocks with market capitalization lower than the amount of cash plus inventories they own.
A lot of these stocks are so cheap because the companies are in distress and will eventually go bankrupt. But the rest of the stocks bought with an extreme discount statistically gain more, and the overall portfolio return is highly positive.
Get Premium Strategy Ideas & Pro Reporting
- Unlock Screener & 300+ Advanced Charts
- Browse 1000+ unique strategies
- Get new strategies on bi-weekly basis
- Explore 2000+ academic research papers
- View 800+ out-of-sample backtests
- Design multi-factor multi-asset portfolios
Strategy profile
- Market factors
- Equities
- Financial instruments
- Stocks
- Regions
- Europe
- Number of traded instruments
- 100
more or less, it depends on investor's need for diversification
- Complexity
- Moderate
- Rebalancing period
- Yearly
- Confidence in anomaly's validity
- Strong
- Transaction costs
- Not Reported
- Robustness checks
- Assessed
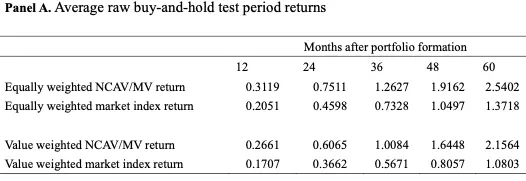
The primary NCAV/MV>1.5 backtest is assessed under equal- and value-weighted portfolio/market-index alternatives (Table 2); its outperformance generally persists. Further tests examine formation-period consistency (Table 3), delistings/liquidations (Table 4), CAPM beta and volatility (Table 5), size-matched control portfolios (Table 8), and Fama-French three-factor regressions (Table 9). Size adjustment weakens the result and is insignificant over 1–3 years, but remains significant over 4–5 years (50.24% and 71.05% size-adjusted buy-and-hold returns); the authors conclude that neither size nor the three-factor model fully explains the NCAV premium.
Source-paper performance
- Backtest period
- 1980 – 2005
- Indicative performance
- 31.19%
per annum, long only portfolio, benchmark market return 20,51% (data from table 2 panel A, equally weighted stocks)
- Estimated volatility
- Not reported
not stated
- Maximum drawdown
- -76.86%
not stated
- Sharpe ratio
- Not reported
Simple trading strategy
The investment universe consists of all stocks on the London Exchange. Companies with more than one class of ordinary shares and foreign companies are excluded. Also excluded are companies on the lightly regulated markets and companies which belong to the financial sector. The portfolio of stocks is formed annually in July. Only those stocks with an NCAV/MV higher than 1.5 are included in the NCAV/MV portfolio. This Buy-and-hold portfolio is held for one year. Stocks are weighted equally.
Hedge for stocks during bear markets
No – Long-only value stocks logically can't be used as a hedge against market drops as a lot of strategy's performance comes from equity market premium (as the investor holds equities, therefore, his correlation to the broad equity market is very very high). Now, evidence for using a long-short value factor portfolio as a hedge against the equity market is very mixed. Firstly, there are a lot of definitions of value factor (from simple standard P/B ratios to various more complex definitions as in this strategy), and the performance of different value factors differ in times of stress. Also, there are multiple research papers in a tone of work of Cakici and Tan : "Size, Value, and Momentum in Developed Country Equity Returns: Macroeconomic and Liquidity Exposures" that link value factor premium to liquidity and growth risk and show that the implication is that value returns can be low prior to periods of low global economic growth and bad liquidity.
Out-of-sample strategy implementation in QuantConnect (chart, statistics & code)
Related picture
Source paper
Xiao, Arnold: Testing Benjamin Graham's Net Current Asset Value Strategy in London
Abstract: It is widely recognized that value strategies - those that invest in stocks with low market values relative to measures of their fundamentals (e.g. low prices relative to earnings, dividends, book assets and cash flows) - tend to show higher returns. In this paper we focus on the early value metric devised and employed by Benjamin Graham - net current asset value to market value (NCAV/MV) - to see if it is still useful in the modern context. Examining stocks listed on the London Stock Exchange for the period 1981 to 2005 we observe that those with an NCAV/MV greater than 1.5 display significantly positive market-adjusted returns (annualized return up to 19.7% per year) over five holding years. We allow for the possibility that the phenomenon being observed is due to the additional return experienced on smaller companies (the "size effect") and still find an NCAV/MV premium. The profitability of this NCAV/MV strategy in the UK cannot be explained using Capital Asset Pricing Model (CAPM). Further, Fama and French's three-factor model (FF3M) can not explain the abnormal return of the NCAV/MV strategy. These premiums might be due to irrational pricing.
Other papers
Damodaran: Value Investing: Investing for Grown Ups?
Abstract: Value investors generally characterize themselves as the grown ups in the investment world, unswayed by perceptions or momentum, and driven by fundamentals. While this may be true, at least in the abstract, there are at least three distinct strands of value investing. The first, passive value investing, is built around screening for stocks that meet specific characteristics - low multiples of earnings or book value, high returns on projects and low risk - and can be traced back to Ben Graham’s books on security analysis. The second, contrarian investing, requires investing in companies that are down on their luck and in the market. The third, activist value investing, involves taking large positions in poorly managed and low valued companies and making money from turning them around. While value investing looks impressive on paper, the performance of value investors, as a whole, is no better than that of less “sensible” investors who chose other investment philosophies and strategies. We examine explanations for why "active" value investing may not provide the promised payoffs.
Lauterbach, Vu: Ben Graham's Net Current Asset Value Rule Revisited: The Size-Adjusted Returns
Abstract: The study demonstrates how size controls can alter the outlook of an investment strategy. The Ben Graham net current asset value rule provides excellent excess returns according to traditional performance measures. Size adjusted procedures, however, reveal that its size adjusted excess return is approximatelly zero.
Oxman, Mohanty, Carlisle: Deep Value Investing and Unexplained Returns
Abstract: The strategy of buying and holding “net nets” has been advocated by deep value investors for decades, but systematic studies of the returns to such a strategy are few. We detail the returns generated from a net nets strategy implemented from 1984 - 2008, and then attempt to explain the excess returns (alpha) generated by the net nets strategy. We find that monthly returns amount to 2.55%, and excess returns using a simple market model amount to 1.66%. After controlling for a variety of risk factors and firm characteristics, and imposing several filters, we find a remaining significant excess return.